Gene expression in different human cell types
Source:R/HPA_cell_type_expression.R
HPA_cell_type_expression.RdPlots a heatmap of genes expression in the different human cell types based on scRNAseq data obtained from the Human Protein Atlas (https://www.proteinatlas.org)
Usage
HPA_cell_type_expression(
  genes = NULL,
  units = c("scaled", "TPM", "log_TPM"),
  include_CTP = FALSE,
  scale_lims = NULL,
  values_only = FALSE
)
Arguments
- genes
characternaming the selected genes. The default value,NULL, takes all CT (specific) genes.- units
character(1)with expression values unit. Can be"TPM","log_TPM"(log(TPM + 1)) or"scaled"(scaled TPM values). Default is"scaled".- include_CTP
logical(1)IfTRUE, CTP genes are included. (FALSEby default).- scale_lims
vector of length 2setting the lower and upper limits of the heatmap colorbar.- values_only
logical(1). IfTRUE, the function will return the SummarizedExperiment instead of the heatmap. Default isFALSE.
Value
A heatmap of selected CT genes expression in
different human cell types.
If values_only = TRUE, a SummarizedExperiment instead of the heatmap
is returned instead.
Examples
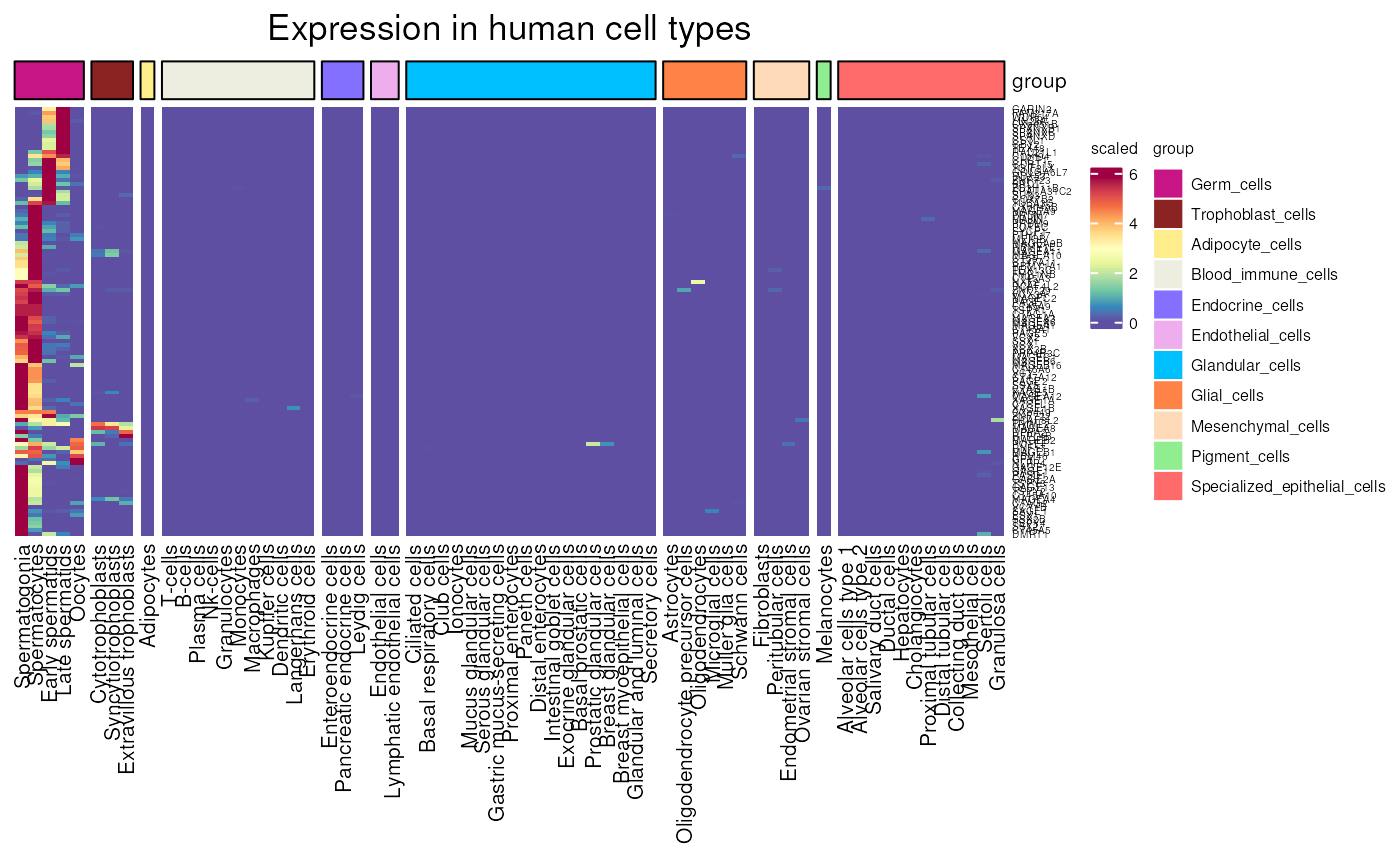
HPA_cell_type_expression(
genes = NULL, units = "scaled", scale_lims = NULL,
values_only = FALSE)
#> see ?CTdata and browseVignettes('CTdata') for documentation
#> loading from cache
#> Warning: 29 out of 146 names invalid: KAZN-AS1, NFIA-AS1, LRRC52-AS1, LINC01249,
#> THORLNC, LINC01206, LINC02475, LINC02377, SLC7A11-AS1, LINC01098,
#> LINC01511, LINC02241, LINC02228, LINC03004, SEC61G-DT, GTF2I-AS1,
#> LINC00200, LINC02663, LINC01518, LINC02750, TMEM132D-AS1, FAM230C,
#> LINC01193, LINC01413, FLJ36000, LINC00470, LINC02864, DSCR8,
#> MAGEA4-AS1.
#> See the manual page for valid types.
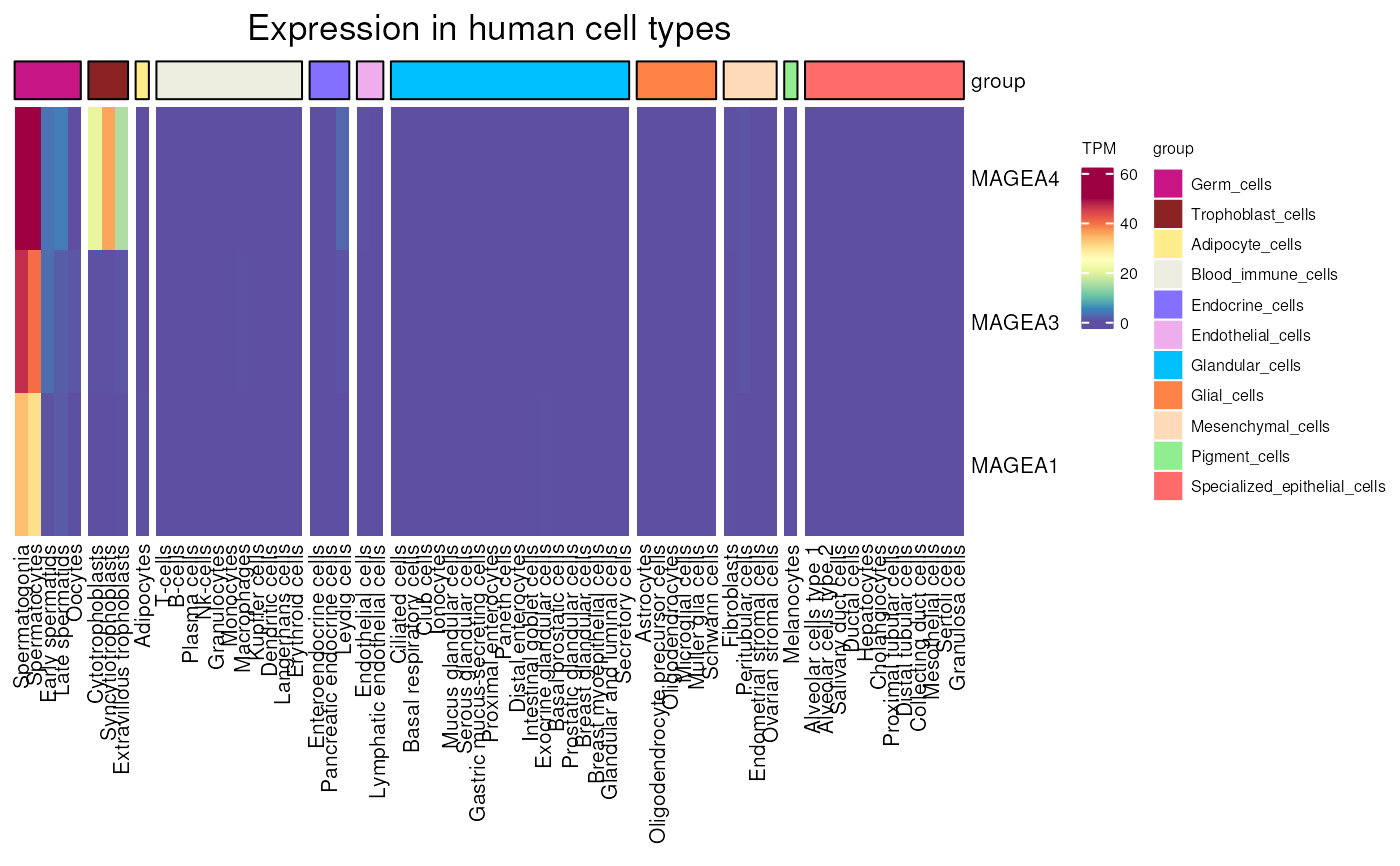
 HPA_cell_type_expression(
genes = c("MAGEA1", "MAGEA3", "MAGEA4"),
units = "TPM", scale_lims = c(0, 50),
values_only = FALSE)
#> see ?CTdata and browseVignettes('CTdata') for documentation
#> loading from cache
HPA_cell_type_expression(
genes = c("MAGEA1", "MAGEA3", "MAGEA4"),
units = "TPM", scale_lims = c(0, 50),
values_only = FALSE)
#> see ?CTdata and browseVignettes('CTdata') for documentation
#> loading from cache