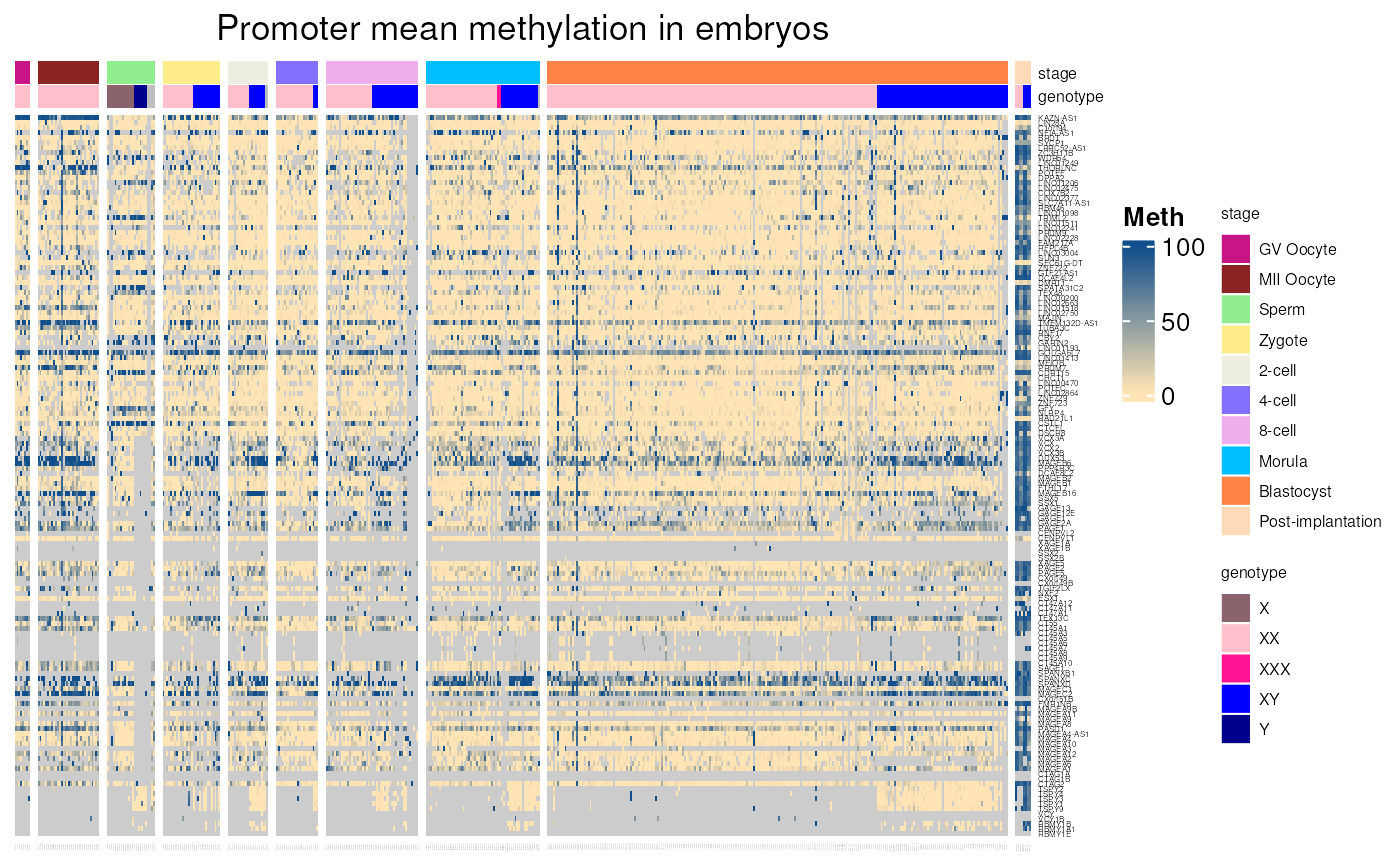
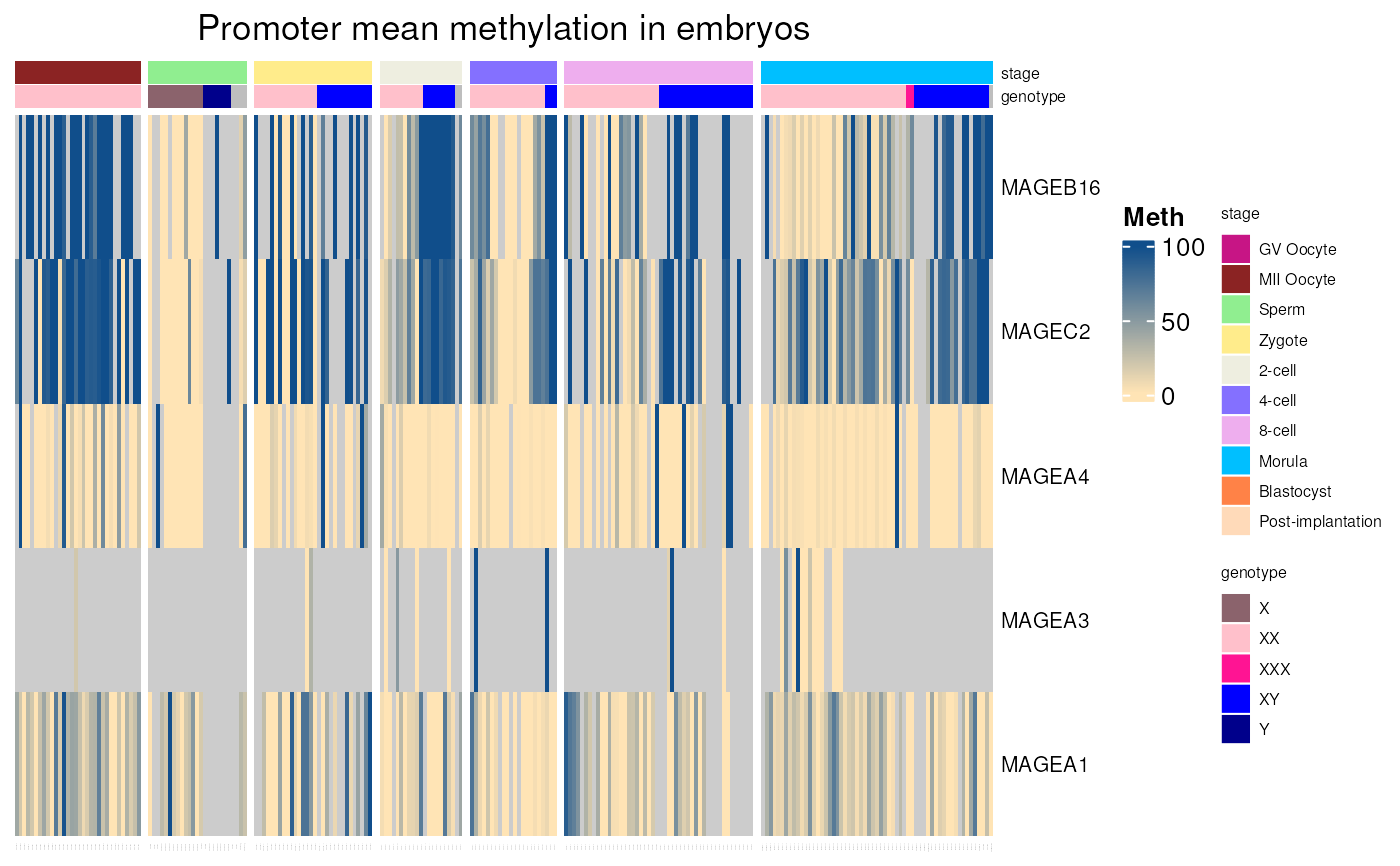
Promoter methylation of any gene in early embryos
Source:R/embryos_mean_methylation.R
embryos_mean_methylation.RdPlots a heatmap of mean promoter methylation levels of any genes in early embryos, using WGSB data from ("Single-cell DNA methylome sequencing of human preimplantation embryos". Zhu et al. Nat genetics 2018). Methylation levels in tissues correspond to the mean methylation of CpGs located in range of 1000 pb upstream and 500 pb downstream from gene TSS.
Usage
embryos_mean_methylation(
  genes = NULL,
  stage = c("GV Oocyte", "MII Oocyte", "Sperm", "Zygote", "2-cell", "4-cell", "8-cell",
    "Morula", "Blastocyst", "Post-implantation"),
  include_CTP = FALSE,
  values_only = FALSE
)
Arguments
- genes
characternaming the selected genes. The default value,NULL, takes all CT (specific) genes.- stage
characterdefining the cell types to be plotted. Can be "GV Oocyte", "MII Oocyte", "Sperm", "Zygote", "2-cell", "4-cell", "8-cell", "Morula", "Blastocyst", "Post-implantation".- include_CTP
logical(1)IfTRUE, CTP genes are included. (FALSEby default).- values_only
logical(1),FALSEby default. IfTRUE, the function will return the methylation values in all samples instead of the heatmap.
Value
Heatmap of mean promoter methylation of any gene in embryos.
If values_only = TRUE, a RangedSummarizedExperiment with methylation values
is returned instead.
Examples
embryos_mean_methylation()
#> see ?CTdata and browseVignettes('CTdata') for documentation
#> loading from cache
#> Warning: 2 out of 146 names invalid: FAM230C, FLJ36000.
#> See the manual page for valid types.

embryos_mean_methylation(c("MAGEA1", "MAGEA3", "MAGEA4", "MAGEC2", "MAGEB16"),
stage = c( "MII Oocyte", "Sperm", "Zygote", "2-cell", "4-cell", "8-cell",
"Morula"))
#> see ?CTdata and browseVignettes('CTdata') for documentation
#> loading from cache
