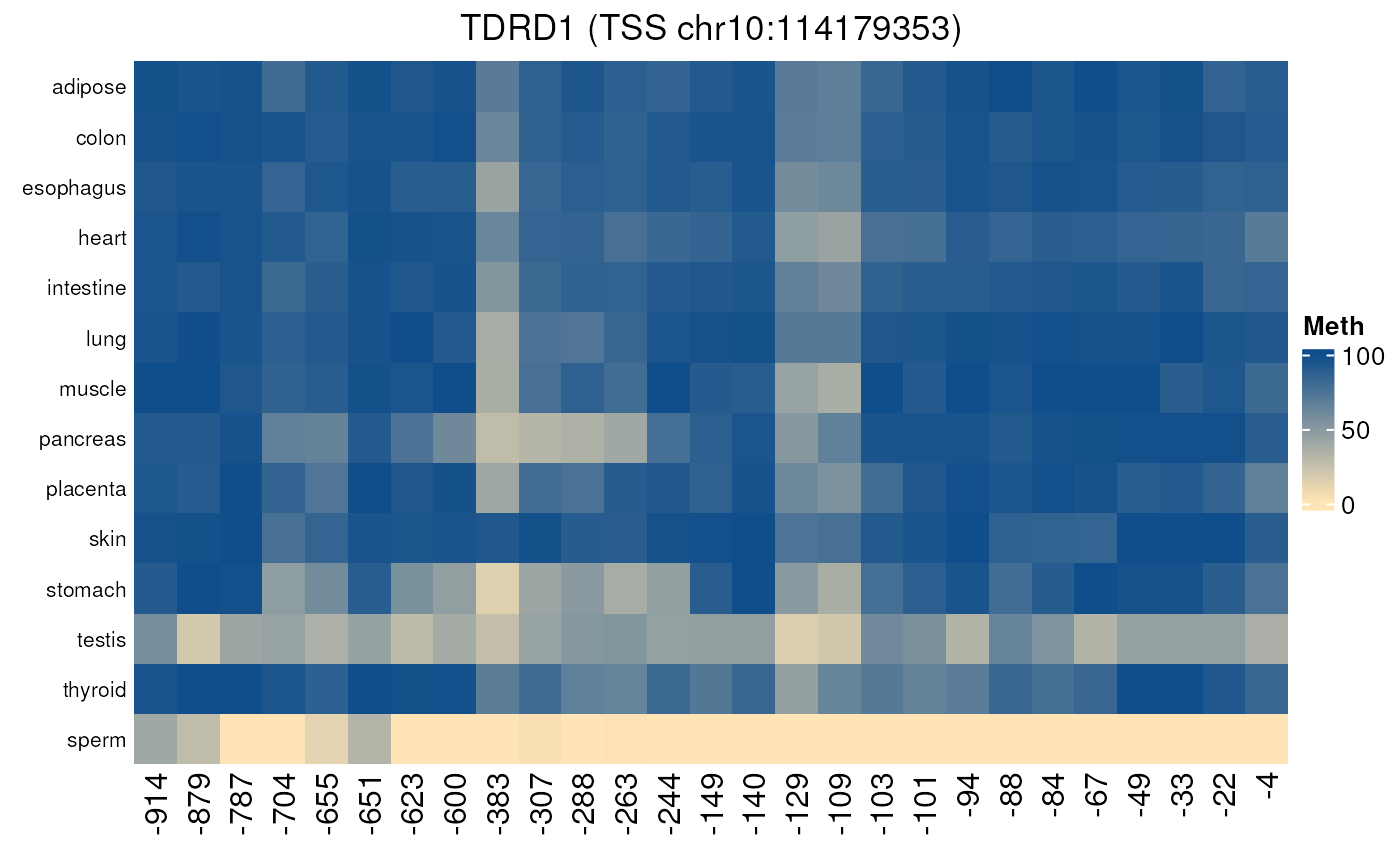
Methylation of CpGs located in promoters in normal tissues
Source:R/normal_tissues_methylation.R
normal_tissues_methylation.RdPlots a heatmap of the methylation of CpGs located in a promoter, in normal tissues. X-axis corresponds to the CpGs position (related to TSS).
Arguments
- gene
Name of selected gene
- nt_up
Number of nucleotides upstream the TSS to analyse (by default 1000, maximum value 5000)
- nt_down
Number of nucleotides downstream the TSS to analyse (by default 200, maximum value 5000)
- values_only
Boolean (FALSE by default). If set to TRUE, the function will return the methylation values of all cytosines in the promoter instead of the heatmap.
