Plot a flow frame in 1D with explicit user given scale transform
Source:R/plots.R
plotScaleTransformedChannel.RdThis function plots a 1D view, i.e. the marginal distribution for one specified channel, of the given flow frame, using the specific user-provided scale transformation parameters.
Arguments
- ff
the
flowFrameto be plotted- channel
the name of the channel of which to display the marginal distribution (i.e. the channel name used as column in the ff expression matrix).
- applyTransform
if "data", data are explicitly transformed using the user provided sclae transformation parameters, before display if "axis scale only" (default), the data are not transformed, i.e. only the x axis scale is defined according to the scale transformation parameters.
- transfoType
the transformation type, currently only
linearandlogicle(bi-exponential) are supported.- linA
the intercept parameter of the linear transformation.
- linB
the slope parameter of the linear transformation.
- t
the max scale parameter of the logicle tranformation.
- m
the number of positive decades of the logicle tranformation.
- w
the width parameter of the logicle transformation.
- a
the number of additional decades on the negative side for the logicle transformation.
Examples
# run CytoPipeline object first
outputDir <- base::tempdir()
rawDataDir <-
system.file("extdata", package = "CytoPipeline")
experimentName <- "OMIP021_PeacoQC"
sampleFiles <-
file.path(
rawDataDir,
list.files(rawDataDir, pattern = "Donor"))
jsonDir <- system.file("extdata", package = "CytoPipeline")
jsonPath <- file.path(jsonDir, "pipelineParams.json")
pipL2 <- CytoPipeline(
jsonPath,
experimentName = experimentName,
sampleFiles = sampleFiles)
suppressWarnings(execute(
pipL2,
rmCache = TRUE,
path = outputDir))
#> #####################################################
#> ### running SCALE TRANSFORMATION processing steps ###
#> #####################################################
#> Proceeding with step 1 [flowframe_read] ...
#> Proceeding with step 2 [remove_margins] ...
#> Removing margins from file : Donor1.fcs
#> Removing margins from file : Donor2.fcs
#> Proceeding with step 3 [compensate] ...
#> Proceeding with step 4 [flowframe_aggregate] ...
#> Proceeding with step 5 [scale_transform_estimate] ...
#> #####################################################
#> ### NOW PRE-PROCESSING FILE /__w/_temp/Library/CytoPipeline/extdata/Donor1.fcs...
#> #####################################################
#> Proceeding with step 1 [flowframe_read] ...
#> Proceeding with step 2 [remove_margins] ...
#> Removing margins from file : Donor1.fcs
#> Proceeding with step 3 [compensate] ...
#> Proceeding with step 4 [remove_doublets] ...
#> Proceeding with step 5 [remove_debris] ...
#> Proceeding with step 6 [remove_dead_cells] ...
#> Proceeding with step 7 [perform_QC] ...
#> Applying PeacoQC method...
#> Starting quality control analysis for Donor1.fcs
#> Calculating peaks
#> MAD analysis removed 30.75% of the measurements
#> The algorithm removed 30.75% of the measurements
#> Proceeding with step 8 [transform] ...
#> #####################################################
#> ### NOW PRE-PROCESSING FILE /__w/_temp/Library/CytoPipeline/extdata/Donor2.fcs...
#> #####################################################
#> Proceeding with step 1 [flowframe_read] ...
#> Proceeding with step 2 [remove_margins] ...
#> Removing margins from file : Donor2.fcs
#> Proceeding with step 3 [compensate] ...
#> Proceeding with step 4 [remove_doublets] ...
#> Proceeding with step 5 [remove_debris] ...
#> Proceeding with step 6 [remove_dead_cells] ...
#> Proceeding with step 7 [perform_QC] ...
#> Applying PeacoQC method...
#> Starting quality control analysis for Donor2.fcs
#> Calculating peaks
#> MAD analysis removed 24.38% of the measurements
#> The algorithm removed 24.38% of the measurements
#> Proceeding with step 8 [transform] ...
ff <- CytoPipeline::getCytoPipelineFlowFrame(
pipL2,
path = outputDir,
whichQueue = "scale transform",
objectName = "flowframe_aggregate_obj"
)
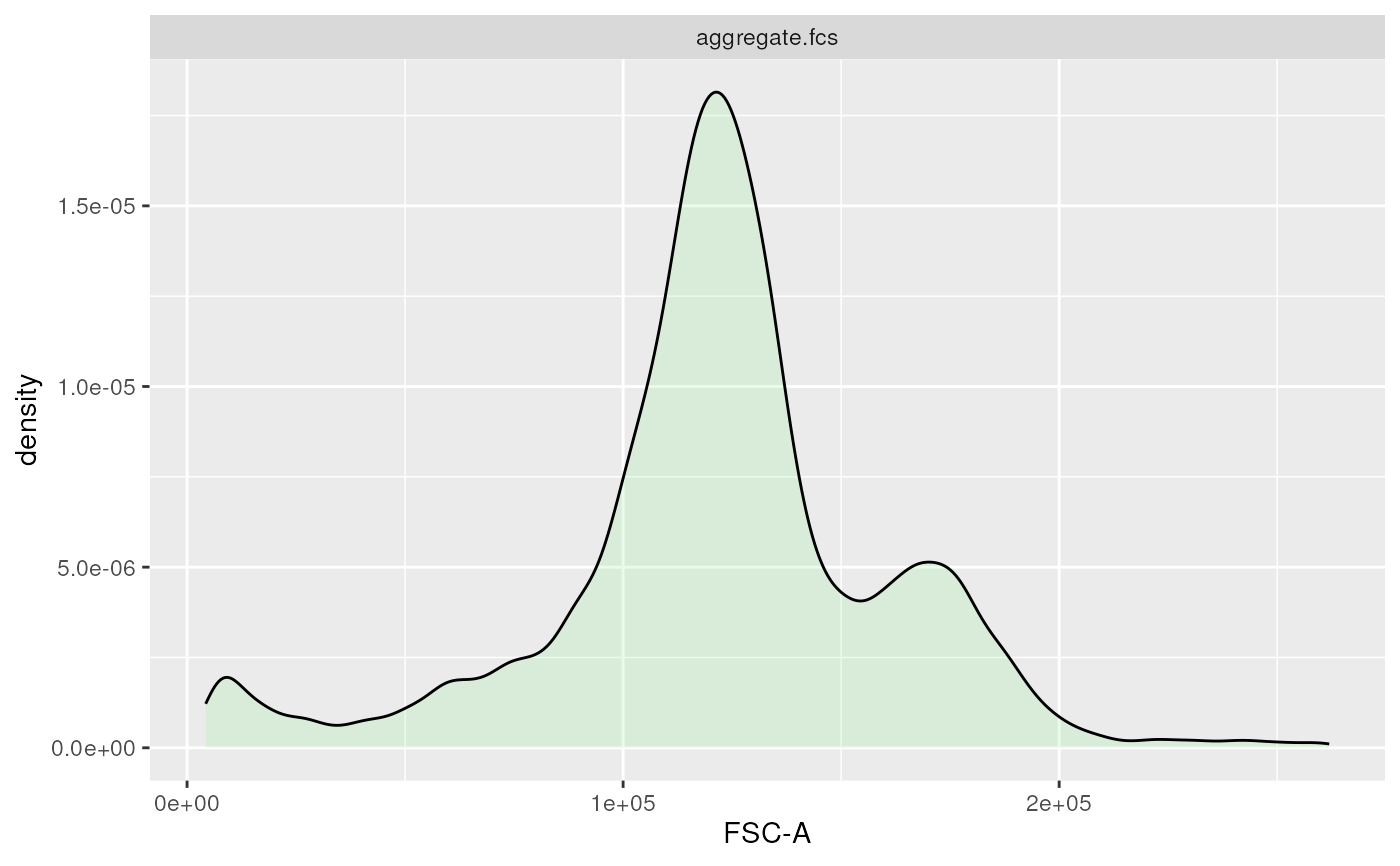
plotScaleTransformedChannel(
ff,
channel = "FSC-A",
transfoType = "linear",
linA = 0.0002,
linB = -0.5)
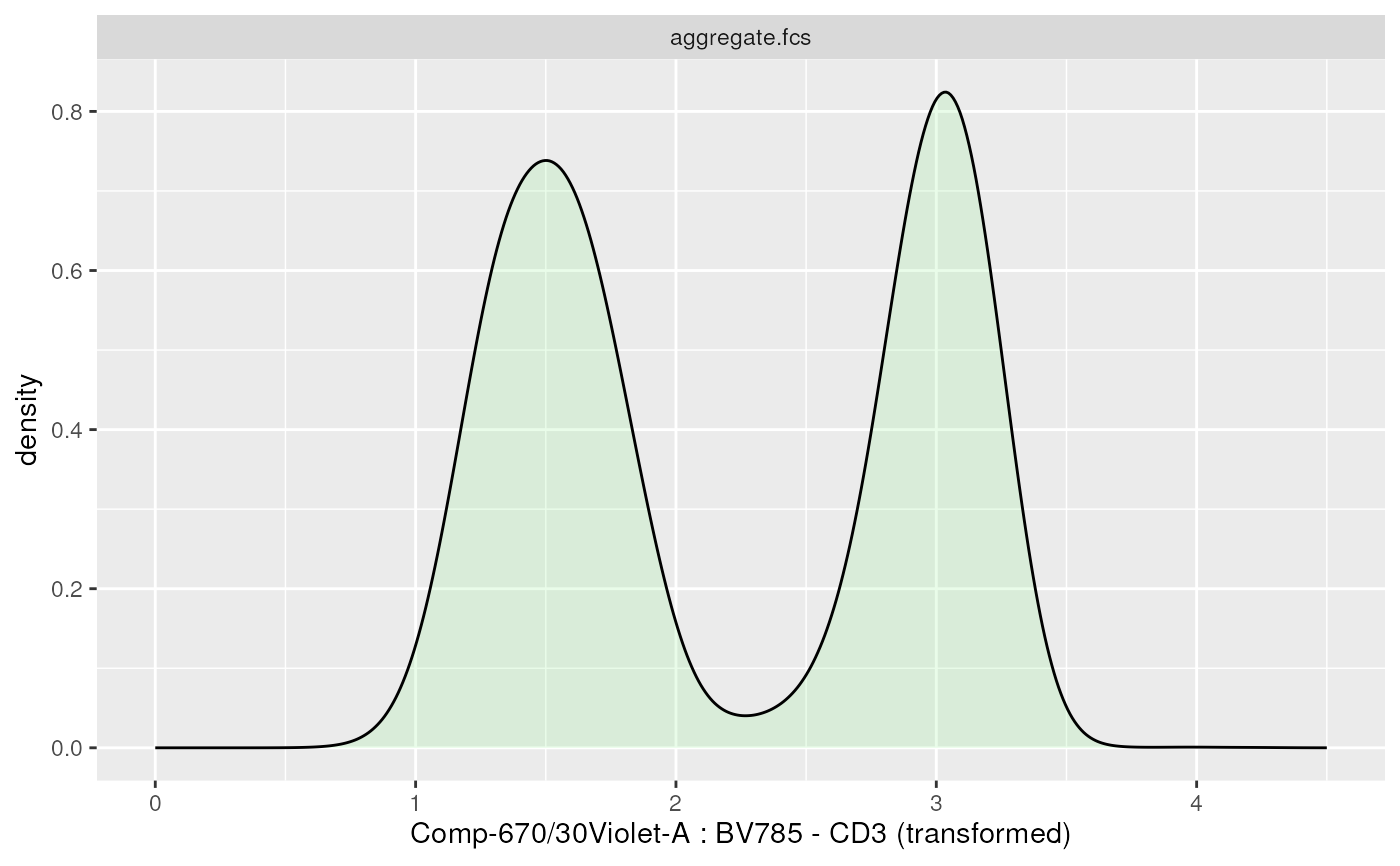
 plotScaleTransformedChannel(
ff,
channel = "Comp-670/30Violet-A",
transfoType = "logicle",
t = 262144,
m = 4.5,
w = 0.5,
a = 1.0
)
plotScaleTransformedChannel(
ff,
channel = "Comp-670/30Violet-A",
transfoType = "logicle",
t = 262144,
m = 4.5,
w = 0.5,
a = 1.0
)
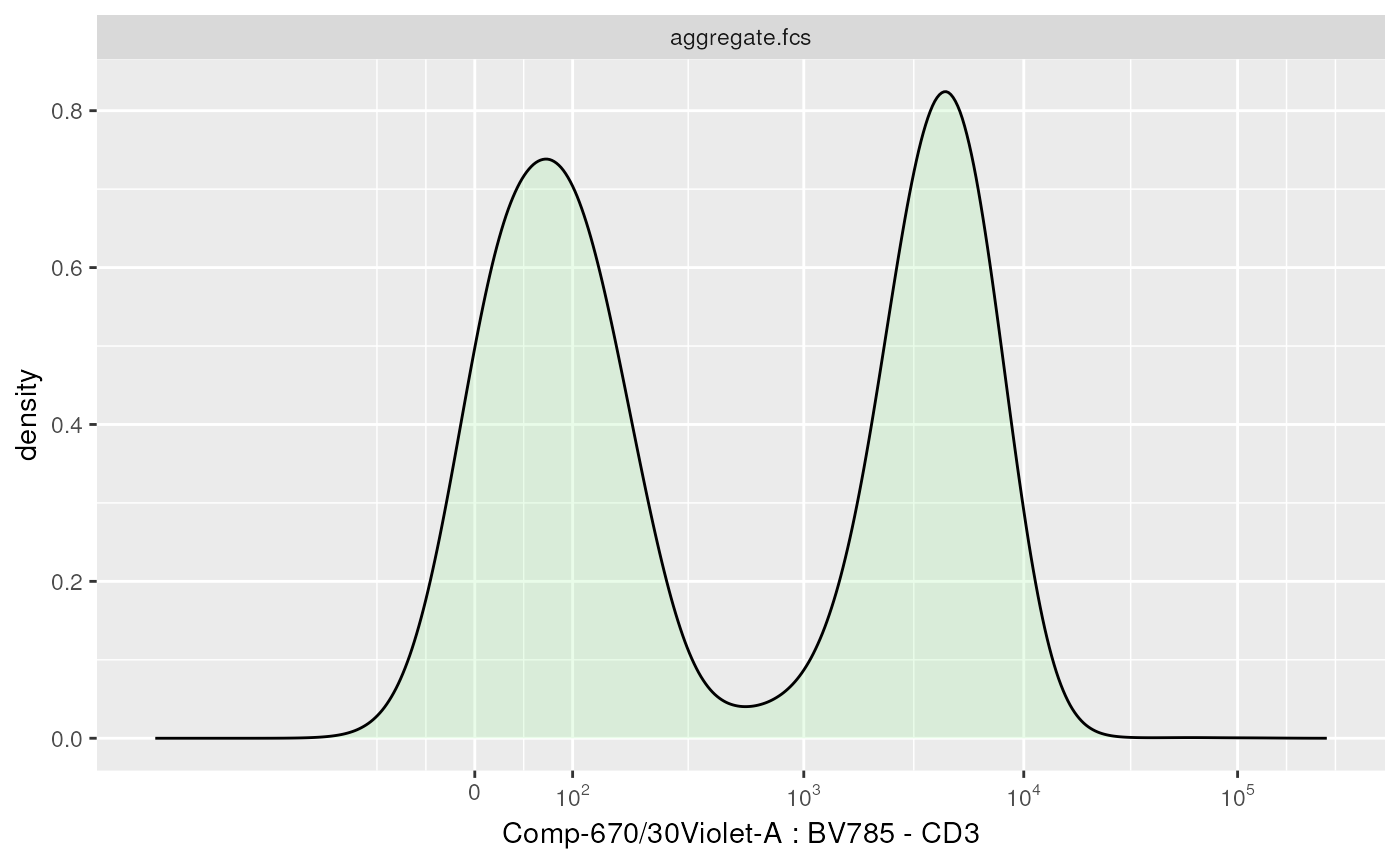 plotScaleTransformedChannel(
ff,
channel = "CD3",
applyTransform = "data",
transfoType = "logicle",
t = 262144,
m = 4.5,
w = 0.5,
a = 1.0
)
plotScaleTransformedChannel(
ff,
channel = "CD3",
applyTransform = "data",
transfoType = "logicle",
t = 262144,
m = 4.5,
w = 0.5,
a = 1.0
)