Based on an experiment name, this function will gather the required flowFrame from the CytoPipeline disk cache and display it using the user chosen 1D or 2D view.
Usage
plotSelectedFlowFrame(
  experimentName,
  whichQueue,
  sampleFile,
  flowFrameName,
  path,
  xChannelLabel,
  yChannelLabel,
  useAllCells,
  nDisplayCells,
  useFixedLinearRange,
  linearRange,
  transfoListName = " "
)
Arguments
- experimentName
the experiment name (representing a pipeline run) from which to extract the flow frame
- whichQueue
"pre-processing" or "scale transform"
- sampleFile
in case 'whichQueue' is set to 'pre-processing, which sample file to look at. This can be a number or a character.
if whichQueue == "scale transform", the sampleFile is ignored
if NULL and whichQueue == "pre-processing", the sampleFile is defaulted to the first one belonging to the experiment
- flowFrameName
the name of the object to fetch (as referenced in the pipeline workflow)
- path
the root path to look for the CytoPipeline experiment cache
- xChannelLabel
the label of the channel to be displayed on the x axis: the conventional syntax is :
channelName+ " - " +channelMarker- yChannelLabel
the label of the channel to be displayed on the y axis: the conventional syntax is :
channelName+ " - " +channelMarker- useAllCells
if TRUE, no subsampling will be done
- nDisplayCells
if useAllCells == FALSE, the number of subsampled cells
- useFixedLinearRange
if TRUE, all channels using a linear scale will use a fixed range set by linearRange
- linearRange
set for all channels using a linear scale, if useFixedLinearRange == TRUE
- transfoListName
if not set to " ", the transformation list (as an object name ending with "_obj", as referenced in the pipeline workflow) to be used for for display.
Examples
# run CytoPipeline object first
outputDir <- base::tempdir()
rawDataDir <-
system.file("extdata", package = "CytoPipeline")
experimentName <- "OMIP021_PeacoQC"
sampleFiles <-
file.path(
rawDataDir,
list.files(rawDataDir, pattern = "Donor"))
jsonDir <- system.file("extdata", package = "CytoPipeline")
jsonPath <- file.path(jsonDir, "pipelineParams.json")
pipL2 <- CytoPipeline(
jsonPath,
experimentName = experimentName,
sampleFiles = sampleFiles)
suppressWarnings(execute(
pipL2,
rmCache = TRUE,
path = outputDir))
#> #####################################################
#> ### running SCALE TRANSFORMATION processing steps ###
#> #####################################################
#> Proceeding with step 1 [flowframe_read] ...
#> Proceeding with step 2 [remove_margins] ...
#> Removing margins from file : Donor1.fcs
#> Removing margins from file : Donor2.fcs
#> Proceeding with step 3 [compensate] ...
#> Proceeding with step 4 [flowframe_aggregate] ...
#> Proceeding with step 5 [scale_transform_estimate] ...
#> #####################################################
#> ### NOW PRE-PROCESSING FILE /__w/_temp/Library/CytoPipeline/extdata/Donor1.fcs...
#> #####################################################
#> Proceeding with step 1 [flowframe_read] ...
#> Proceeding with step 2 [remove_margins] ...
#> Removing margins from file : Donor1.fcs
#> Proceeding with step 3 [compensate] ...
#> Proceeding with step 4 [remove_doublets] ...
#> Proceeding with step 5 [remove_debris] ...
#> Proceeding with step 6 [remove_dead_cells] ...
#> Proceeding with step 7 [perform_QC] ...
#> Applying PeacoQC method...
#> Starting quality control analysis for Donor1.fcs
#> Calculating peaks
#> MAD analysis removed 30.75% of the measurements
#> The algorithm removed 30.75% of the measurements
#> Proceeding with step 8 [transform] ...
#> #####################################################
#> ### NOW PRE-PROCESSING FILE /__w/_temp/Library/CytoPipeline/extdata/Donor2.fcs...
#> #####################################################
#> Proceeding with step 1 [flowframe_read] ...
#> Proceeding with step 2 [remove_margins] ...
#> Removing margins from file : Donor2.fcs
#> Proceeding with step 3 [compensate] ...
#> Proceeding with step 4 [remove_doublets] ...
#> Proceeding with step 5 [remove_debris] ...
#> Proceeding with step 6 [remove_dead_cells] ...
#> Proceeding with step 7 [perform_QC] ...
#> Applying PeacoQC method...
#> Starting quality control analysis for Donor2.fcs
#> Calculating peaks
#> MAD analysis removed 24.38% of the measurements
#> The algorithm removed 24.38% of the measurements
#> Proceeding with step 8 [transform] ...
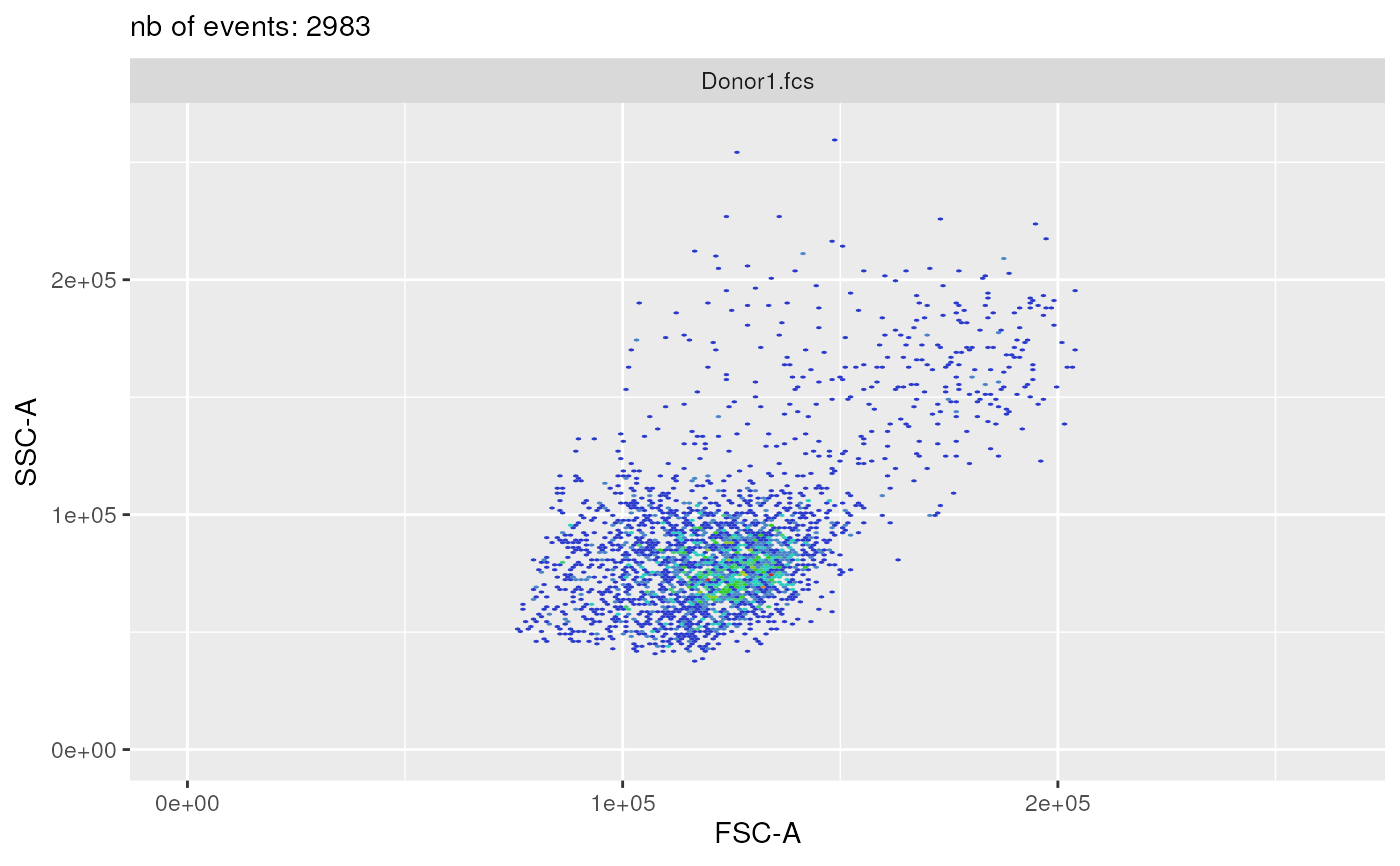
plotSelectedFlowFrame(
experimentName = experimentName,
whichQueue = "pre-processing",
sampleFile = 1,
flowFrameName = "remove_debris_obj",
path = outputDir,
xChannelLabel = "FSC-A : NA",
yChannelLabel = "SSC-A : NA",
useAllCells = TRUE,
nDisplayCells = 0,
useFixedLinearRange = TRUE,
linearRange = c(-100, 262144))
#> displaying flow frame plot...
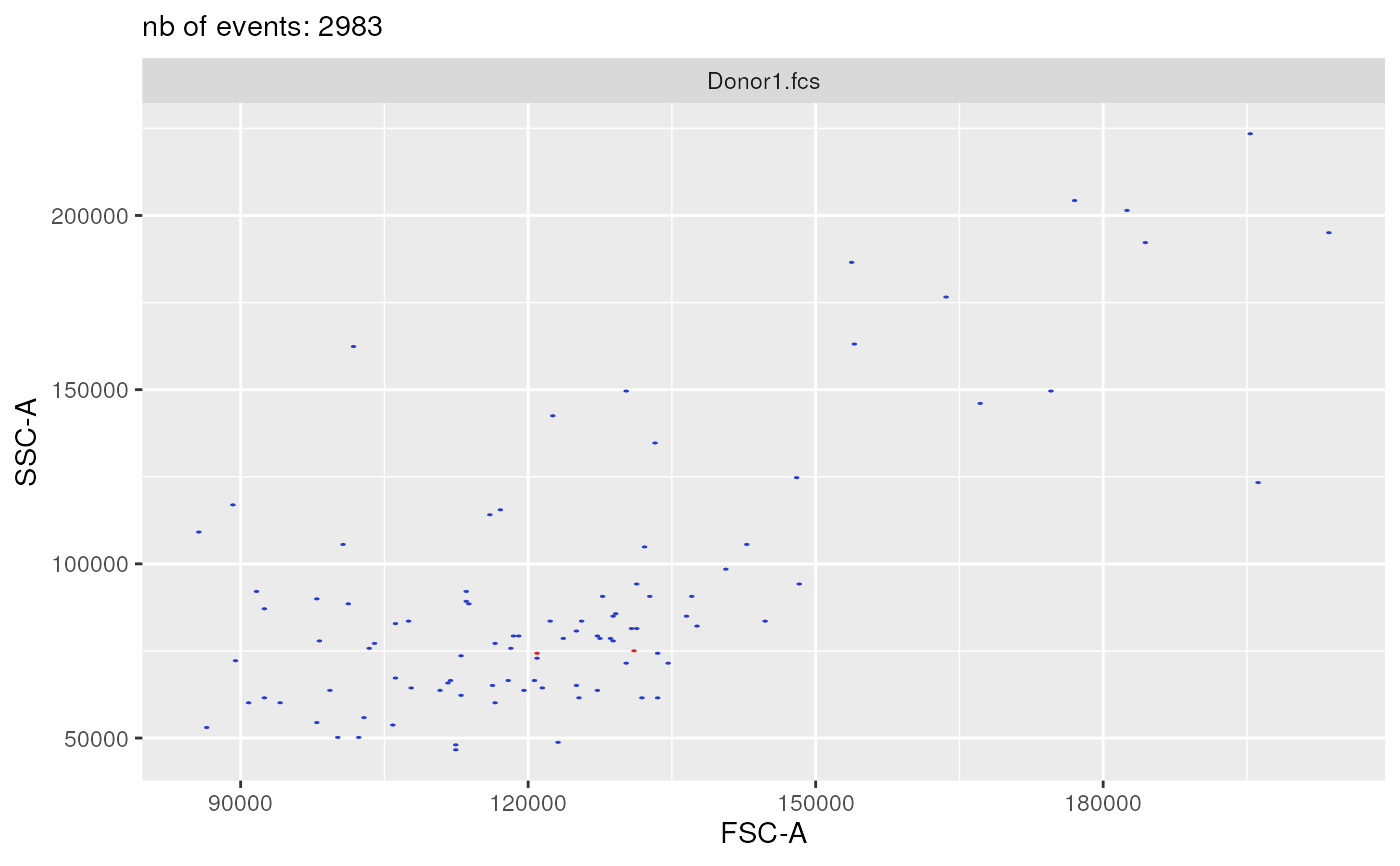
 plotSelectedFlowFrame(
experimentName = experimentName,
whichQueue = "pre-processing",
sampleFile = 1,
flowFrameName = "remove_debris_obj",
path = outputDir,
xChannelLabel = "FSC-A : NA",
yChannelLabel = "SSC-A : NA",
useAllCells = FALSE,
nDisplayCells = 100,
useFixedLinearRange = FALSE,
linearRange = NULL)
#> displaying flow frame plot...
plotSelectedFlowFrame(
experimentName = experimentName,
whichQueue = "pre-processing",
sampleFile = 1,
flowFrameName = "remove_debris_obj",
path = outputDir,
xChannelLabel = "FSC-A : NA",
yChannelLabel = "SSC-A : NA",
useAllCells = FALSE,
nDisplayCells = 100,
useFixedLinearRange = FALSE,
linearRange = NULL)
#> displaying flow frame plot...
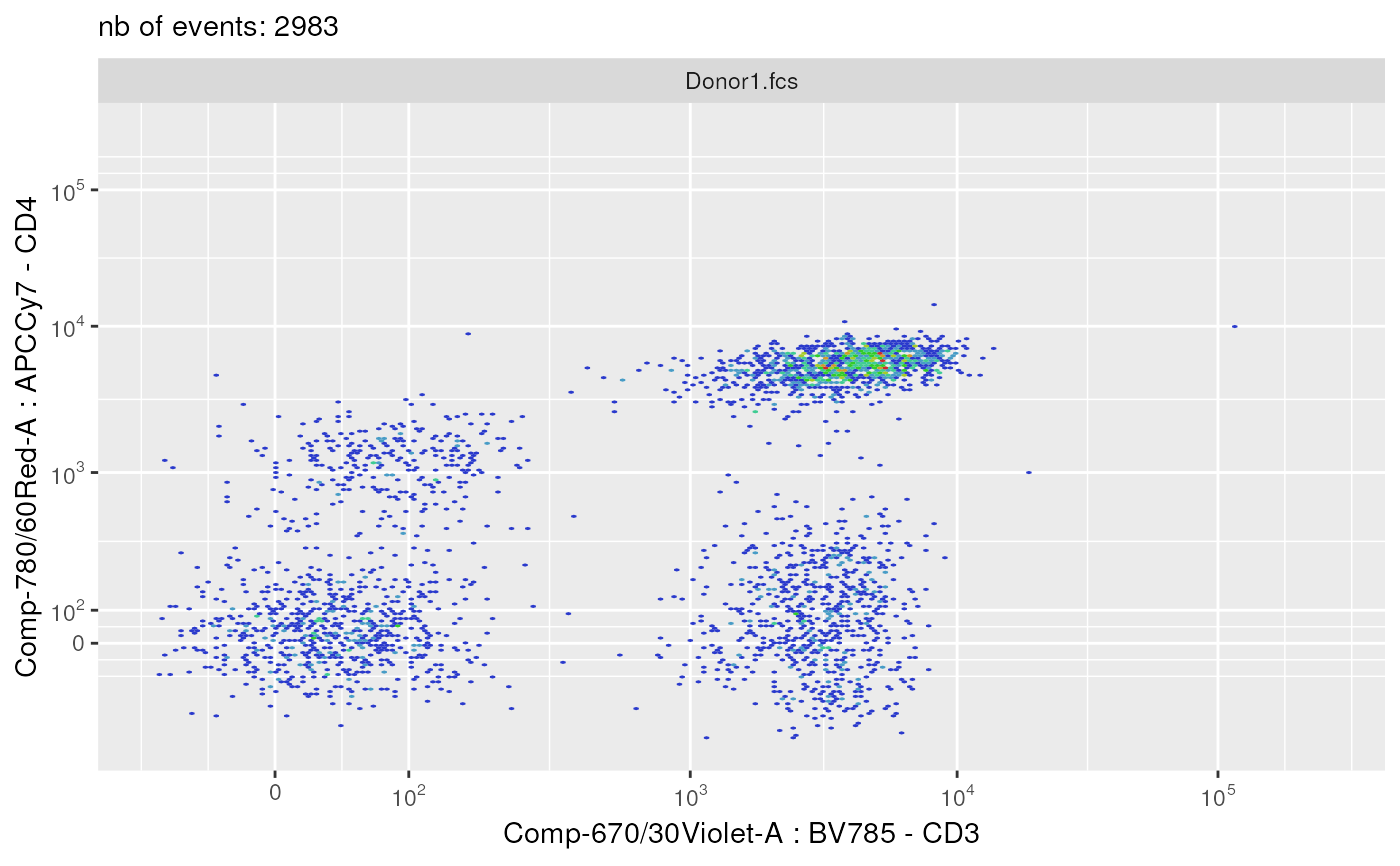
 plotSelectedFlowFrame(
experimentName = experimentName,
whichQueue = "pre-processing",
sampleFile = 1,
flowFrameName = "remove_debris_obj",
path = outputDir,
xChannelLabel = "Comp-670/30Violet-A : BV785 - CD3",
yChannelLabel = "Comp-780/60Red-A : APCCy7 - CD4",
useAllCells = TRUE,
nDisplayCells = 0,
useFixedLinearRange = FALSE,
linearRange = NULL,
transfoListName = "scale_transform_estimate_obj")
#> displaying flow frame plot...
plotSelectedFlowFrame(
experimentName = experimentName,
whichQueue = "pre-processing",
sampleFile = 1,
flowFrameName = "remove_debris_obj",
path = outputDir,
xChannelLabel = "Comp-670/30Violet-A : BV785 - CD3",
yChannelLabel = "Comp-780/60Red-A : APCCy7 - CD4",
useAllCells = TRUE,
nDisplayCells = 0,
useFixedLinearRange = FALSE,
linearRange = NULL,
transfoListName = "scale_transform_estimate_obj")
#> displaying flow frame plot...