plot events of specific channels of either : flowCore::flowFrame, or flowCore::flowSet in 2D, showing the impact of applying a filter between :
a 'pre' flowframe
Usage
ggplotFilterEvents(
  ffPre,
  ffPost,
  xChannel,
  yChannel,
  nDisplayCells = 10000,
  seed = NULL,
  size = 0.5,
  xScale = c("linear", "logicle"),
  yScale = c("linear", "logicle"),
  xLogicleParams = NULL,
  yLogicleParams = NULL,
  xLinearRange = NULL,
  yLinearRange = NULL,
  transList = NULL,
  runTransforms = FALSE,
  interactive = FALSE
)
Arguments
- ffPre
a flowCore::flowFrame, before applying filter
- ffPost
a flowCore::flowFrame, after applying filter
- xChannel
channel (name or index) or marker name to be displayed on x axis
- yChannel
channel (name or index) or marker name to be displayed on y axis
- nDisplayCells
maximum number of events that will be plotted. If the number of events exceed this number, a subsampling will be performed
- seed
seed used for sub-sampling (if any)
- size
used by geom_point()
- xScale
scale to be used for the x axis (note "linear" corresponds to no transformation)
- yScale
scale to be used for the y axis (note "linear" corresponds to no transformation)
- xLogicleParams
if (xScale == "logicle"), the parameters of the logicle transformation to be used, as a list(w = ..., m = ..., a = ..., t = ...) If NULL, these parameters will be estimated by flowCore::estimateLogicle()
- yLogicleParams
if (yScale == "logicle"), the parameters of the logicle transformation to be used, as a list(w = ..., m = ..., a = ..., t = ...) If NULL, these parameters will be estimated by flowCore::estimateLogicle()
- xLinearRange
if (xScale == "linear"), linear range to be used
- yLinearRange
if (yScale == "linear"), linear range to be used
- transList
optional list of scale transformations to be applied to each channel. If it is non null, 'x/yScale', 'x/yLogicleParams' and 'x/yLinear_range' will be discarded.
- runTransforms
(TRUE/FALSE) Will the application of non linear scale result in data being effectively transformed ?
If TRUE, than the data will undergo transformations prior to visualization.
If FALSE, the axis will be scaled but the data themselves are not transformed.
- interactive
if TRUE, transform the scaling formats such that the ggcyto::x_scale_logicle() and ggcyto::y_scale_logicle() do work with plotly::ggplotly()
Examples
data(OMIP021Samples)
ffPre <- OMIP021Samples[[1]]
# creating a manual polygon gate filter based on channels L/D and FSC-A
LDMarker <- "L/D Aqua - Viability"
LDChannel <- getChannelNamesFromMarkers(ffPre, markers = LDMarker)
liveGateMatrix <- matrix(
data = c(
50000, 50000, 100000, 200000, 200000,
100, 1000, 2000, 2000, 1
),
ncol = 2,
dimnames = list(
c(),
c("FSC-A", LDChannel)
)
)
liveGate <- flowCore::polygonGate(
filterId = "Live",
.gate = liveGateMatrix
)
selectedLive <- flowCore::filter(ffPre, liveGate)
ffL <- flowCore::Subset(ffPre, selectedLive)
# show the results
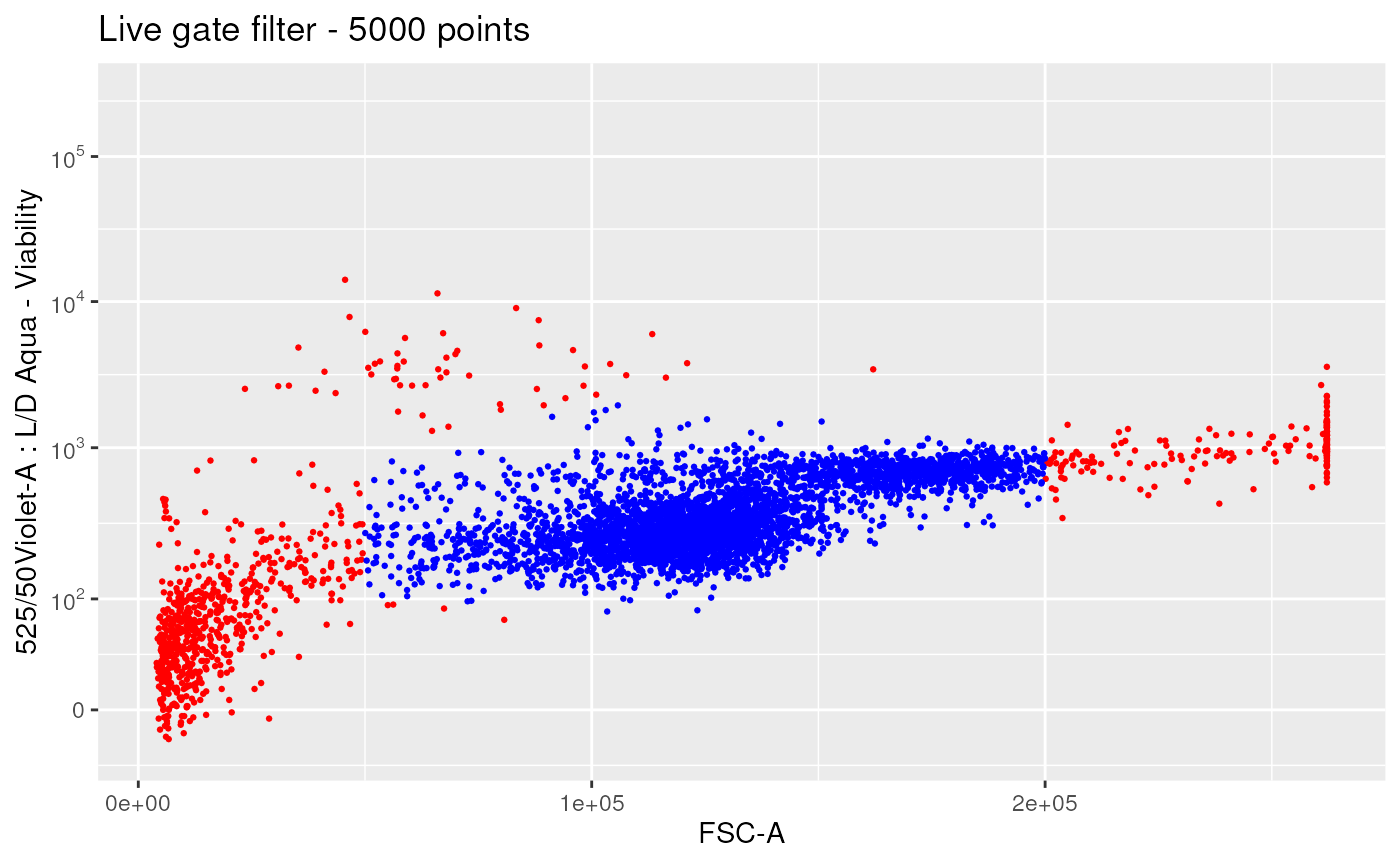
# subsample 5000 points
ggplotFilterEvents(
ffPre = ffPre,
ffPost = ffL,
nDisplayCells = 5000,
xChannel = "FSC-A", xScale = "linear",
yChannel = LDMarker, yScale = "logicle") +
ggplot2::ggtitle("Live gate filter - 5000 points")
#> Warning: Removed 3 rows containing missing values or values outside the scale range
#> (`geom_point()`).
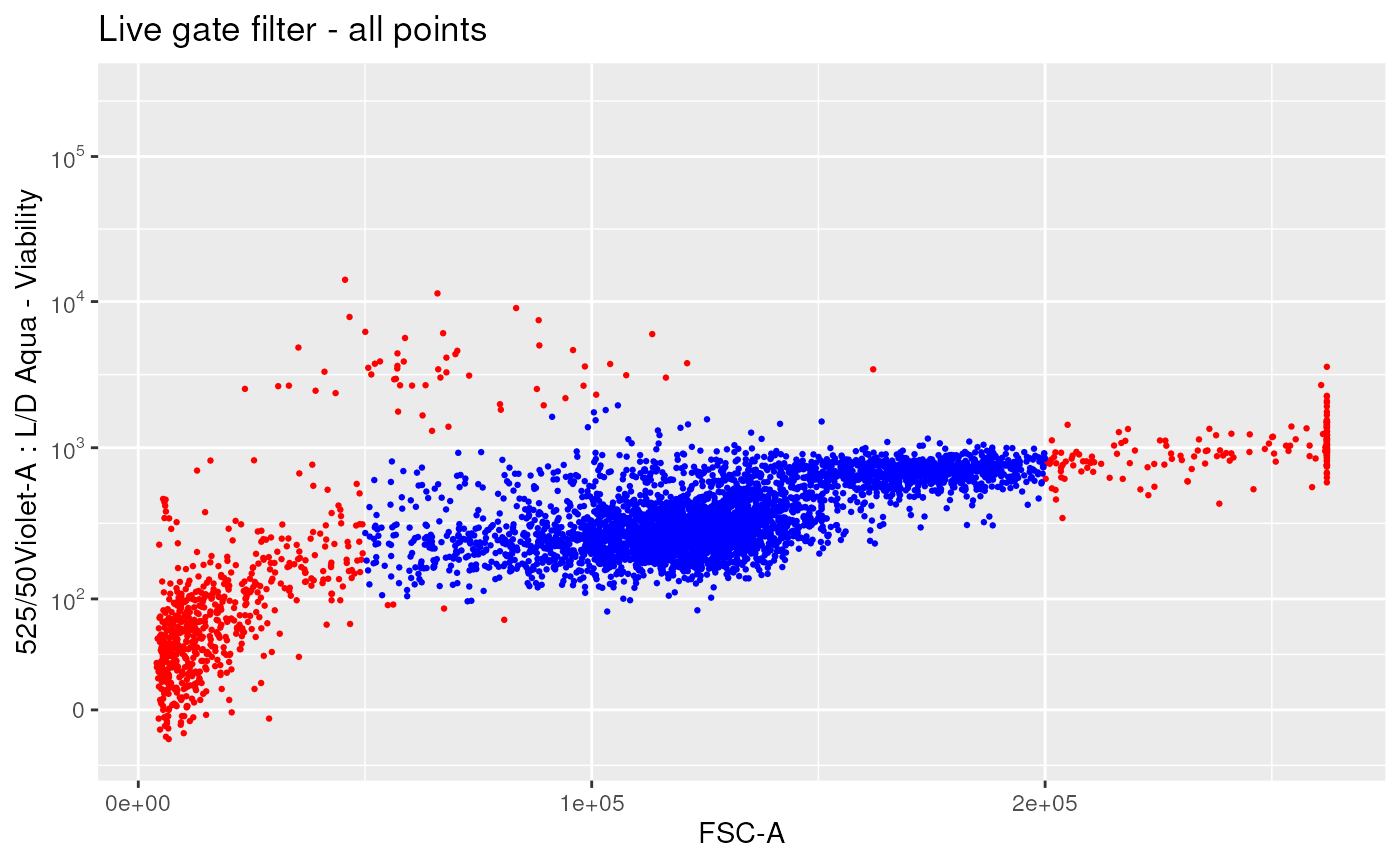
 # with all points
ggplotFilterEvents(
ffPre = ffPre,
ffPost = ffL,
nDisplayCells = Inf,
xChannel = "FSC-A", xScale = "linear",
yChannel = LDMarker, yScale = "logicle") +
ggplot2::ggtitle("Live gate filter - all points")
#> Warning: Removed 3 rows containing missing values or values outside the scale range
#> (`geom_point()`).
# with all points
ggplotFilterEvents(
ffPre = ffPre,
ffPost = ffL,
nDisplayCells = Inf,
xChannel = "FSC-A", xScale = "linear",
yChannel = LDMarker, yScale = "logicle") +
ggplot2::ggtitle("Live gate filter - all points")
#> Warning: Removed 3 rows containing missing values or values outside the scale range
#> (`geom_point()`).