plot flow rate as a function of time, using ggplot2
Examples
data(OMIP021Samples)
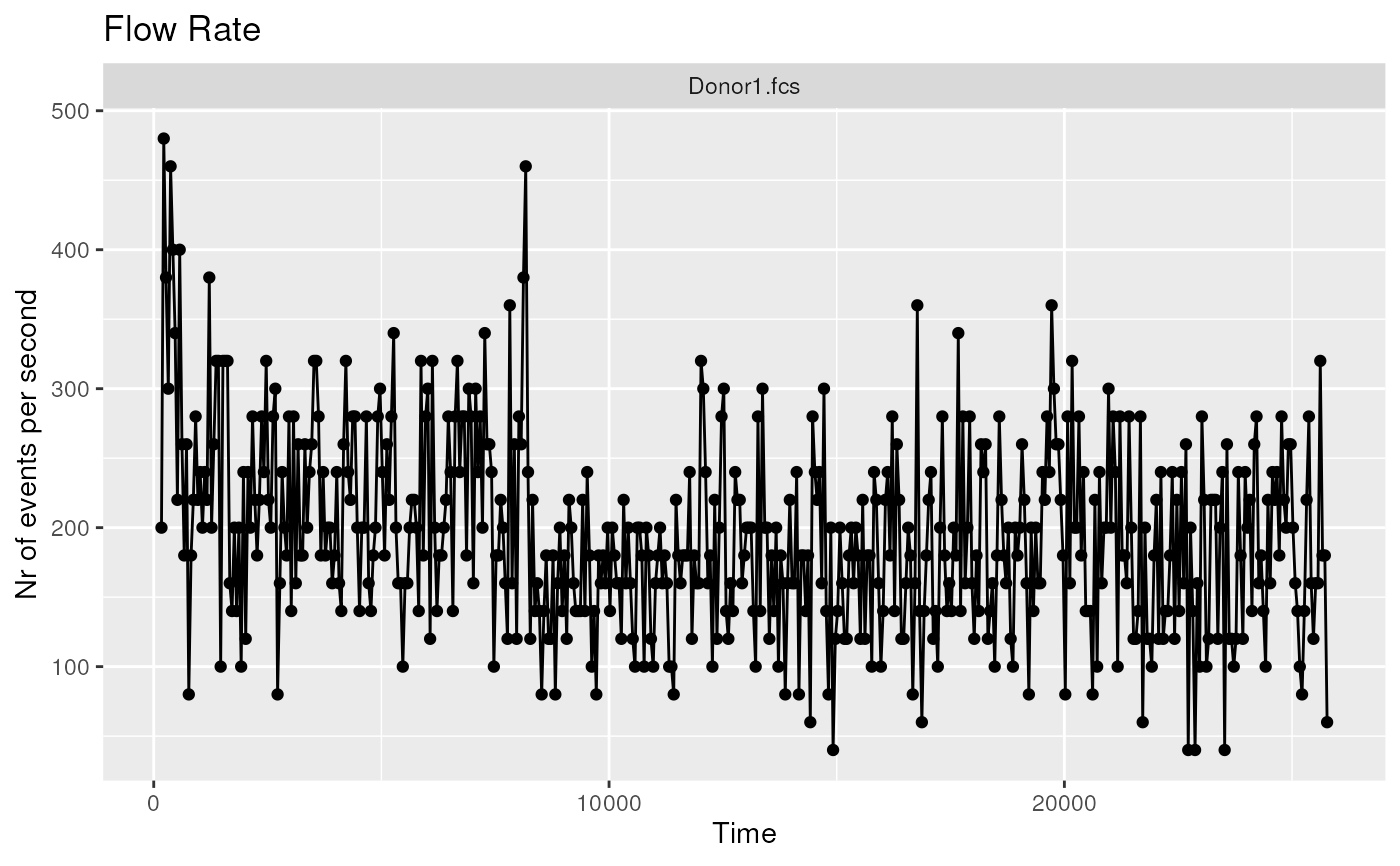
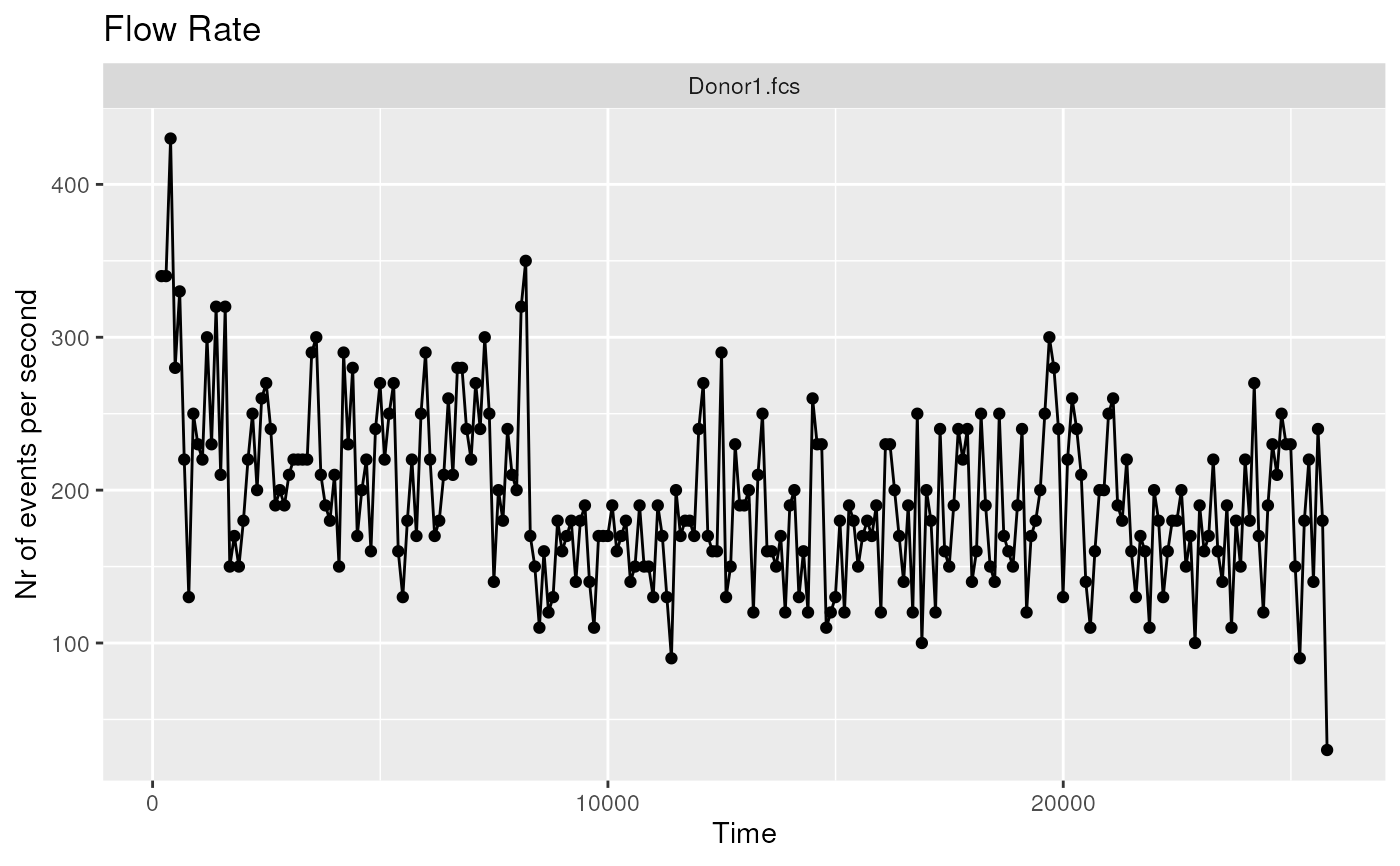
# single flowFrame plot
ggplotFlowRate(OMIP021Samples[[1]])
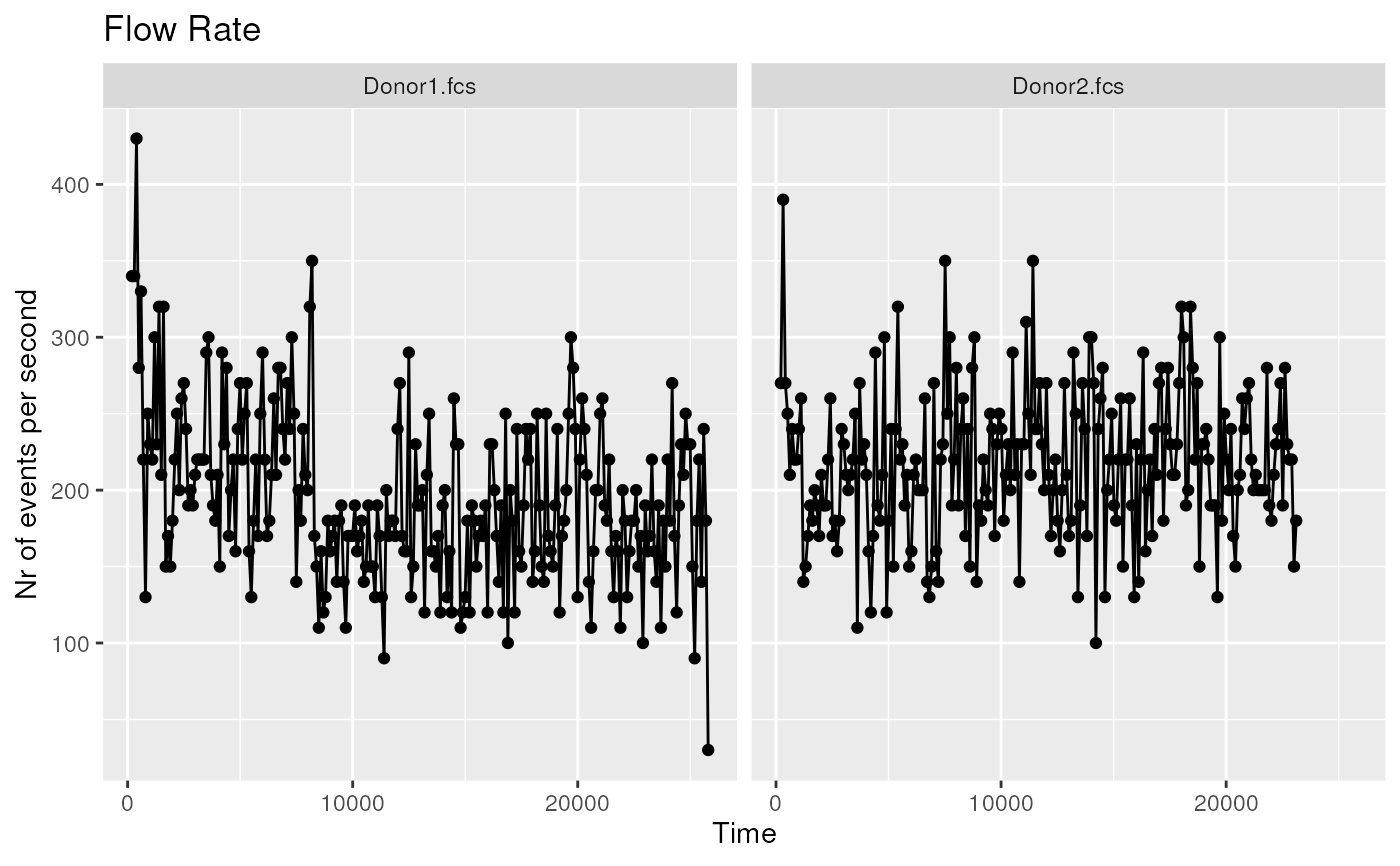
 # two flowFrames plot
ggplotFlowRate(OMIP021Samples)
# two flowFrames plot
ggplotFlowRate(OMIP021Samples)
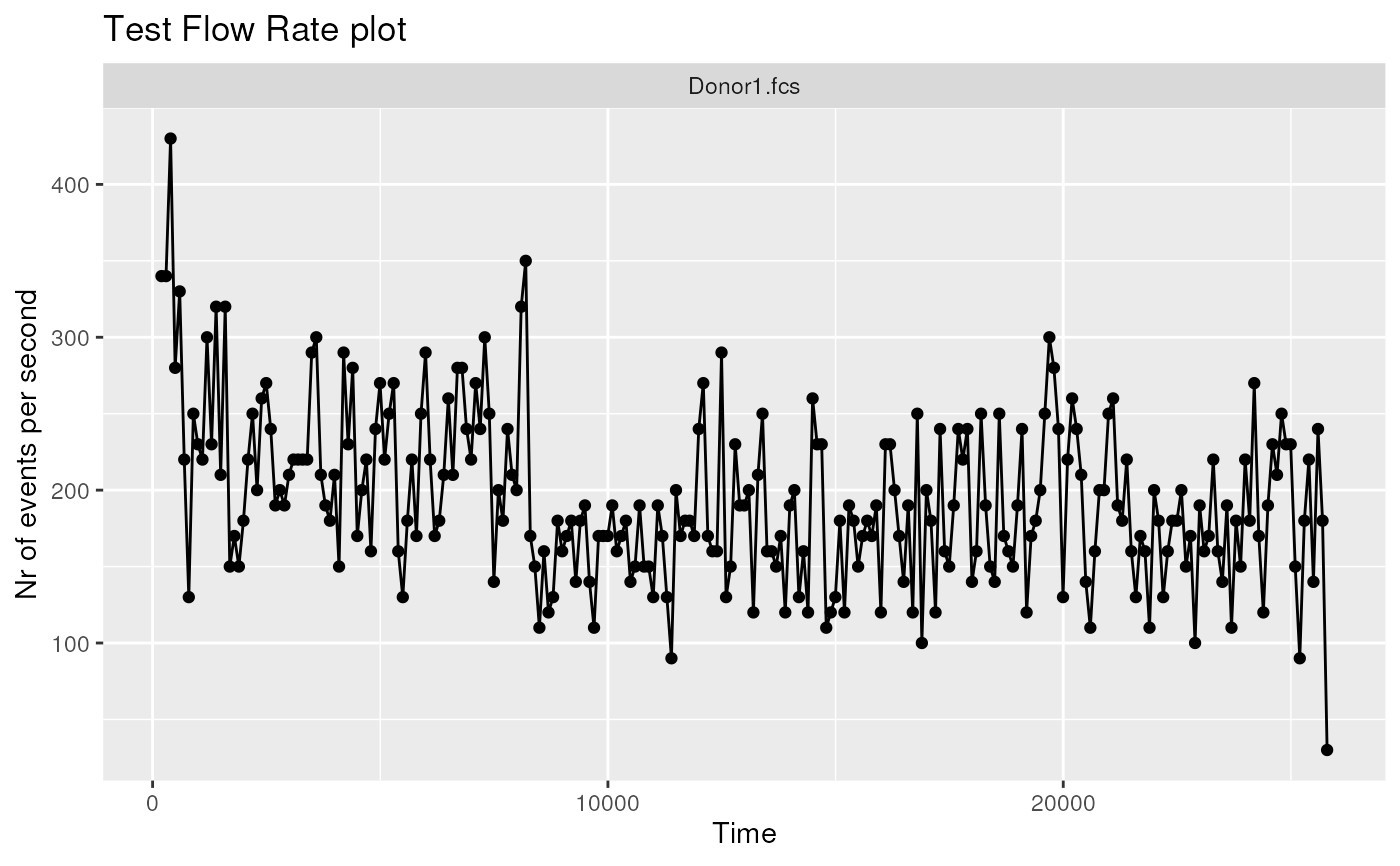
 # single plot with title
ggplotFlowRate(OMIP021Samples[[1]], title = "Test Flow Rate plot")
# single plot with title
ggplotFlowRate(OMIP021Samples[[1]], title = "Test Flow Rate plot")
 # explicit time unit
ggplotFlowRate(OMIP021Samples[[1]], timeUnit = 50)
# explicit time unit
ggplotFlowRate(OMIP021Samples[[1]], timeUnit = 50)