importQFeatures App
Léopold Guyot
6 May 2026
Source:vignettes/importQFeatures.Rmd
importQFeatures.RmdCreate a QFeatures object
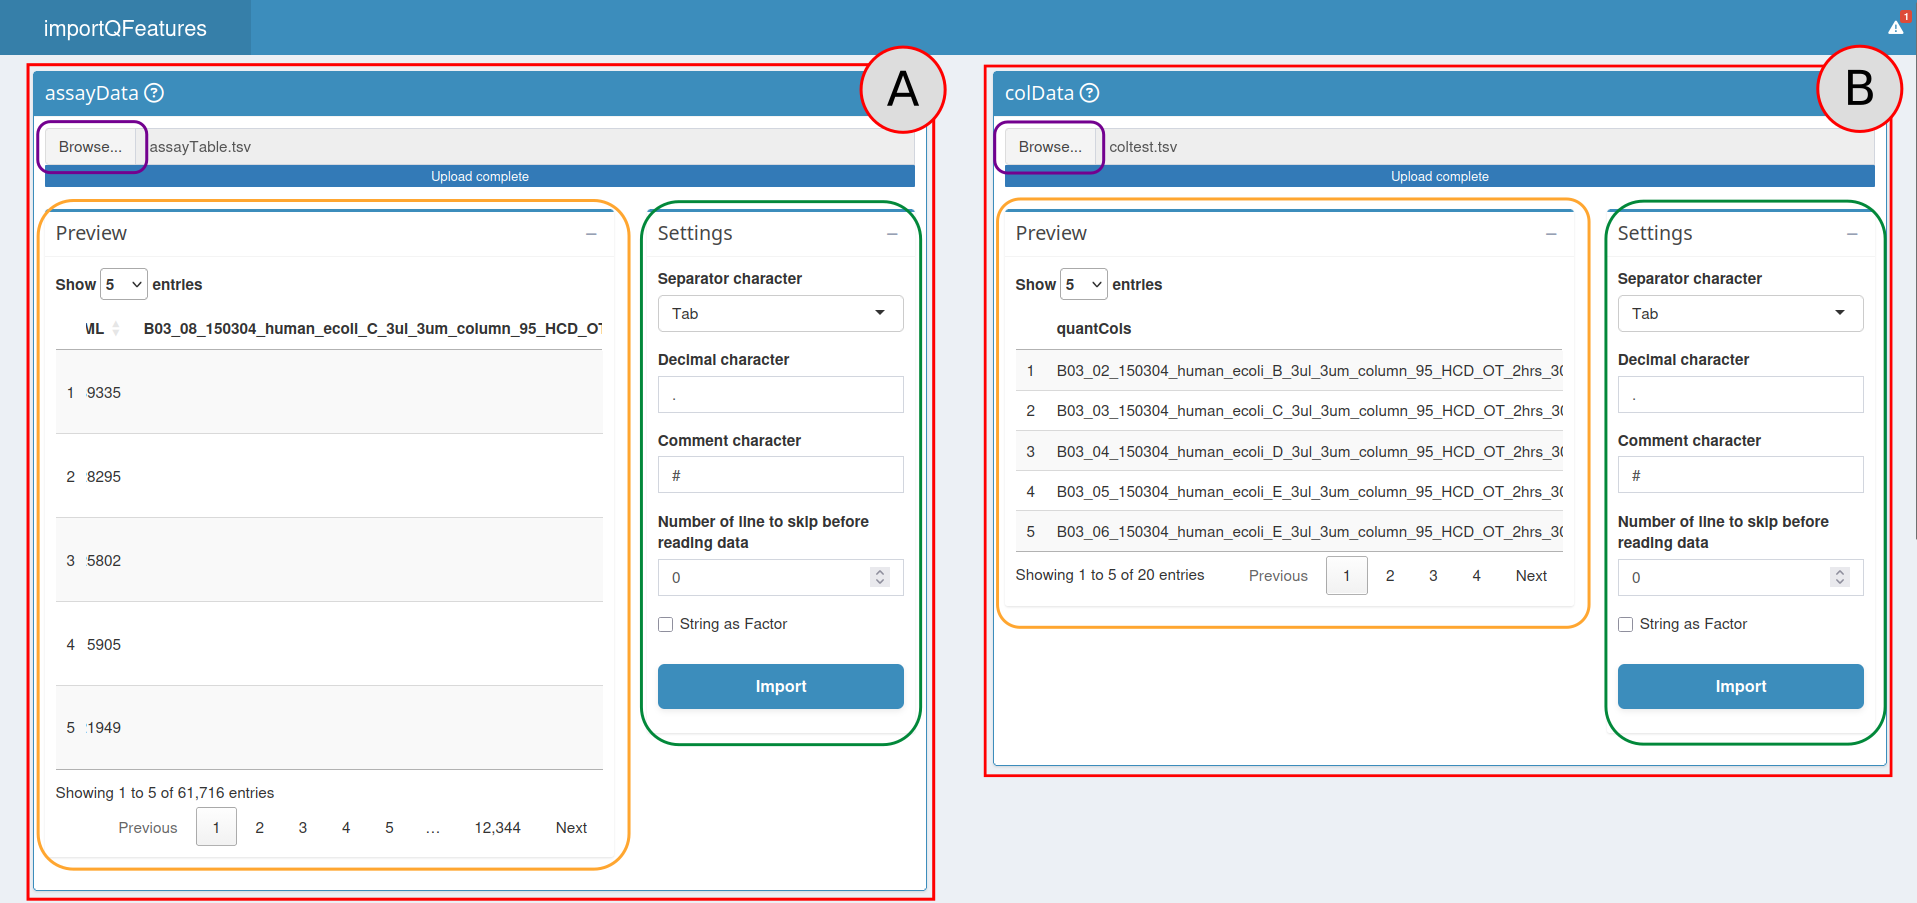
A view of the import section.
Table imports
The first step to create a QFeatures object is to provide two tables:
An assayData Table: The assayData table is generated after the identification and quantification of the MS spectra by a pre-processing software such as MaxQuant, ProteomeDiscoverer or MSFragger .
A colData Table: The colData table contains the experimental design generated by the researcher. The rows of the colData table correspond to a sample in the experiment and the columns correspond to the available annotations about the sample.
More information about these tables can be found in the documentation
of the function
readSCP from the scp package.
To provide the Input Table, use the Input Table box (red box
A). Press the Browse… button (orange box) then
choose the appropriate .csv or .tsv file on
your computer. Once the file has been sectioned, the path to it is
visible next to the Browse… button.
Then look at the Parameters section (purple box). Choose the appropriate options to import your file (see the read.table documentation for more information):
separator character(default = “,”)decimal character(default = “.”)comment character(default = “#”)number of lines to skip before reading the file(default = 0)strings as factor(default = FALSE)
Once all these options are selected for your file, click on the
Import button. Your table is now visible on the Preview box
(green box), make sure it is well formatted before continuing.
The process to import the Sample Table is identical, but this time
use the Sample Table box (red box B).
QFeatures conversion
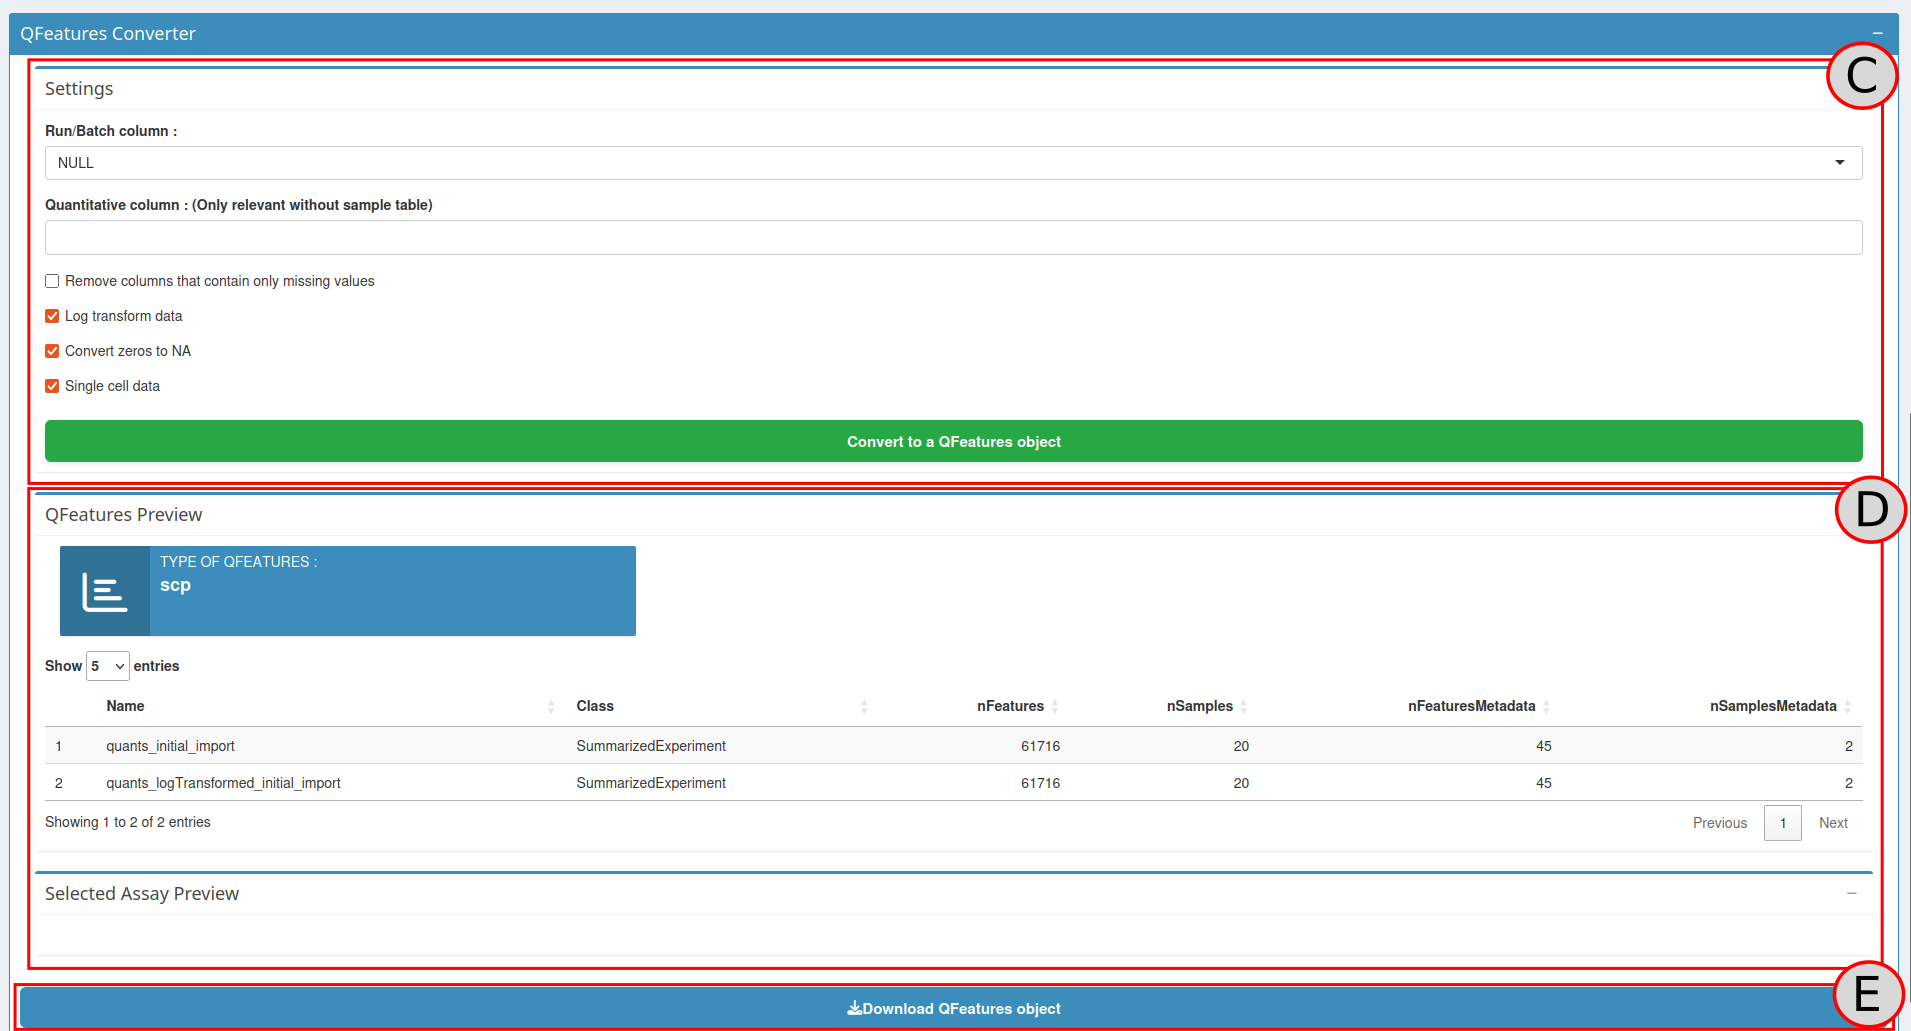
The QFeatures converter tool is available on the right side of the
application in the QFeatures Converter box (C). The first
step to perform a QFeatures conversion is to define the columns that
will be used to create the links between the two tables. This can be
done in the Parameters box (purple box):
batch column: The column of the Input table and the Sample table that contains the batch names.channel column: The column of the Sample table that contains the column names of the quantitative data in the Input table
If the Sample table has correctly been imported, the column names will be available in the drop-down list. Select for each drop-down list the appropriate column. An option to remove in each batch the columns that contains only missing values is also available using a checkbox. More information about these parameters can be found in the readSCP documentation
Once everything is correctly setup, press the
Convert to a QFeatures object button.
QFeatures object export
A QFeatures Preview panel is now visible in the Preview QFeatures box
( D). Check with this preview if the conversion process
went fine. By clicking on a row (corresponding to an assay), the
selected assay will appear below, once again check if everything looks
as expected.
Once everything looks fine, you can download the QFeatures to use it
with R or continue the analysis using processQFeatures()
function.
To download click on the Download button
(E), this will download a .zip file containing
initial_QFeatures.rds the QFeatures object on your computer,
importQFeatures_script.R corresponding to the code lines used
to generate the QFeatures object, and
initial_QFeatures_sessionInfo.html containing a view of all
packages and versions used to generate the QFeatures object. Choose the
destination folder, the name of the folder and click on save. Your
QFeatures object is now available on your computer, it can be used in
combination with the scp package to continue the data processing.