plot events of specific channels of either :
flowCore::flowFrame, or flowCore::flowSet
in 2D or 1D, mimicking FlowJo type of graph.
if 1D : geom_density will be used
if 2D : geom_hex will be used
Usage
ggplotEvents(
  obj,
  xChannel,
  yChannel = NULL,
  nDisplayCells = Inf,
  seed = NULL,
  bins = 216,
  fill = "lightblue",
  alpha = 0.2,
  xScale = c("linear", "logicle"),
  yScale = c("linear", "logicle"),
  xLogicleParams = NULL,
  yLogicleParams = NULL,
  xLinearRange = NULL,
  yLinearRange = NULL,
  transList = NULL,
  runTransforms = FALSE
)
Arguments
- obj
a flowCore::flowFrame or flowCore::flowSet
- xChannel
channel (name or index) or marker name to be displayed on x axis
- yChannel
channel (name or index) or marker name to be displayed on y axis
- nDisplayCells
maximum number of events that will be plotted. If the number of events exceed this number, a sub-sampling will be performed
- seed
seed used for sub-sampling (if any)
- bins
used in geom_hex
- fill
used in geom_density
- alpha
used in geom_density
- xScale
scale to be used for the x axis (note "linear" corresponds to no transformation)
- yScale
scale to be used for the y axis (note "linear" corresponds to no transformation)
- xLogicleParams
if (xScale == "logicle"), the parameters of the logicle transformation to be used, as a list(w = ..., m = ..., a = ..., t = ...). If NULL, these parameters will be estimated by flowCore::estimateLogicle()
- yLogicleParams
if (yScale == "logicle"), the parameters of the logicle transformation to be used, as a list(w = ..., m = ..., a = ..., t = ...). If NULL, these parameters will be estimated by flowCore::estimateLogicle()
- xLinearRange
if (xScale == "linear"), the x axis range to be used
- yLinearRange
if (yScale == "linear"), the y axis range to be used
- transList
optional list of scale transformations to be applied to each channel. If it is non null, 'x/yScale', 'x/yLogicleParams' and 'x/yLinear_range' will be discarded.
- runTransforms
(TRUE/FALSE) Will the application of non linear scale result in data being effectively transformed ?
If TRUE, than the data will undergo transformations prior to visualization.
If FALSE, the axis will be scaled but the data themselves will not be transformed.
Examples
data(OMIP021Samples)
### 1D Examples ###
# simple linear scale example
ggplotEvents(OMIP021Samples[[1]],
xChannel = "FSC-A",
xScale = "linear")
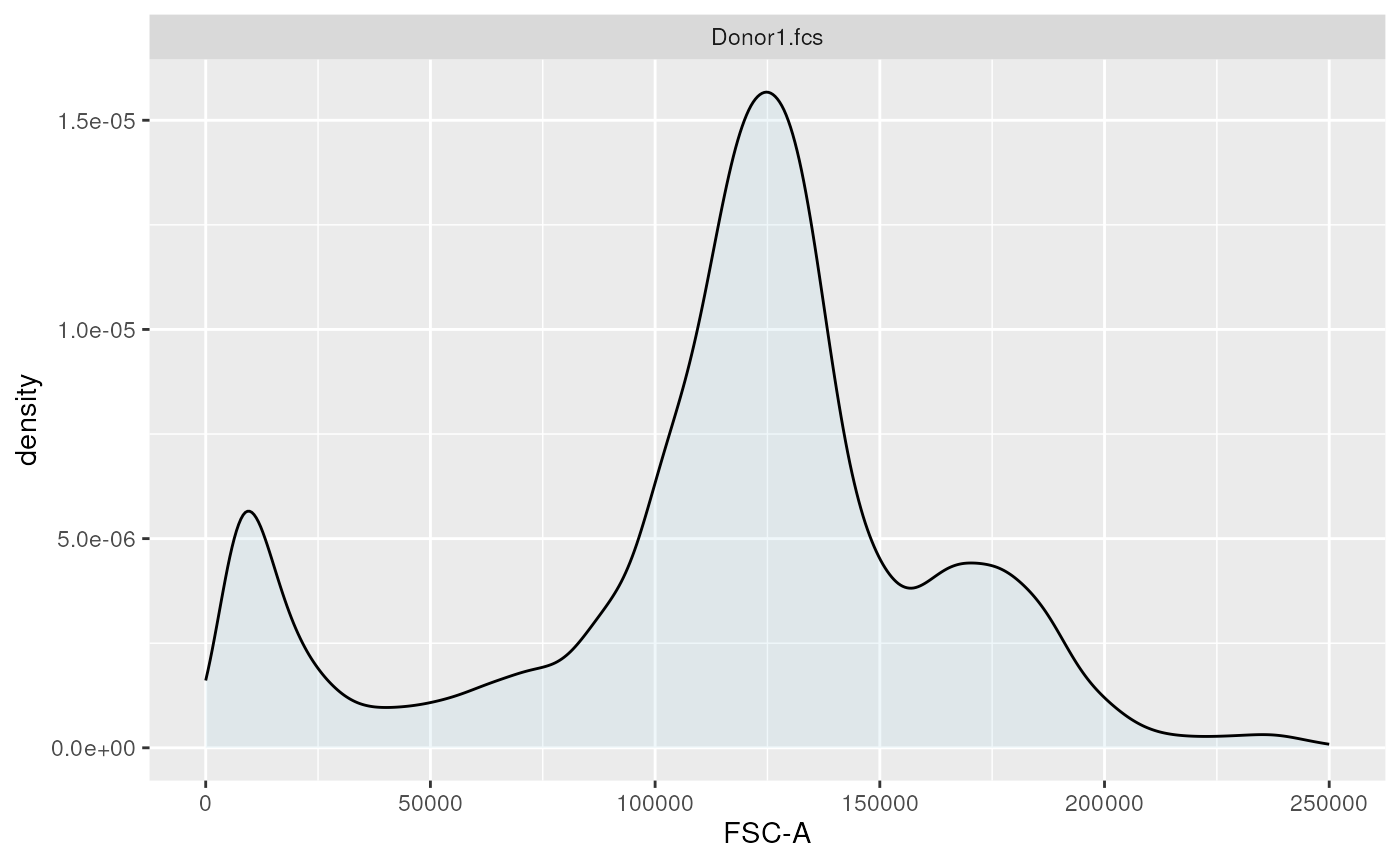
 # with explicit linear range
ggplotEvents(OMIP021Samples[[1]],
xChannel = "FSC-A",
xScale = "linear",
xLinearRange = c(0, 250000))
# with explicit linear range
ggplotEvents(OMIP021Samples[[1]],
xChannel = "FSC-A",
xScale = "linear",
xLinearRange = c(0, 250000))
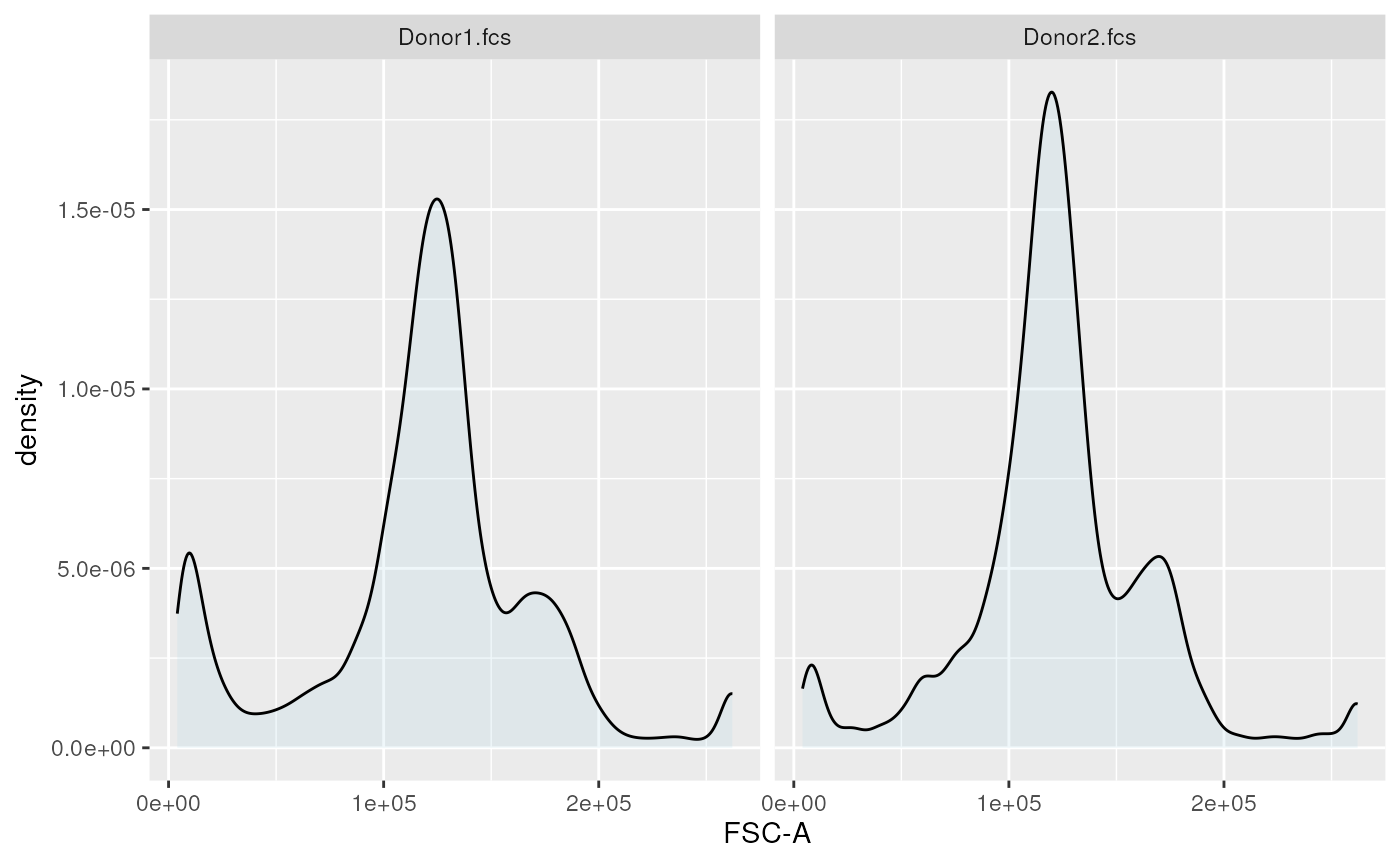
 # with linear scale, several flow frames
ggplotEvents(OMIP021Samples, xChannel = "FSC-A", xScale = "linear")
# with linear scale, several flow frames
ggplotEvents(OMIP021Samples, xChannel = "FSC-A", xScale = "linear")
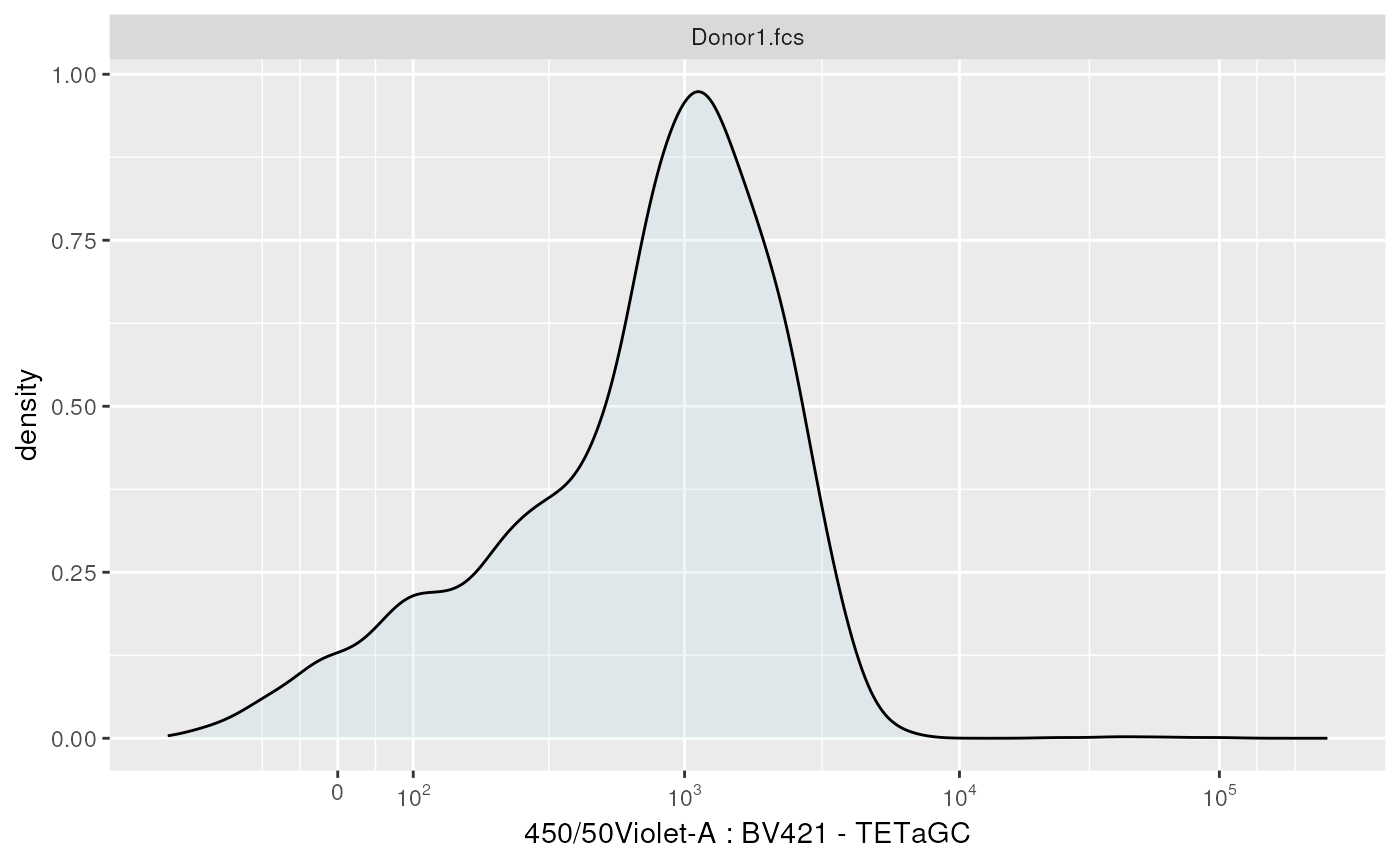
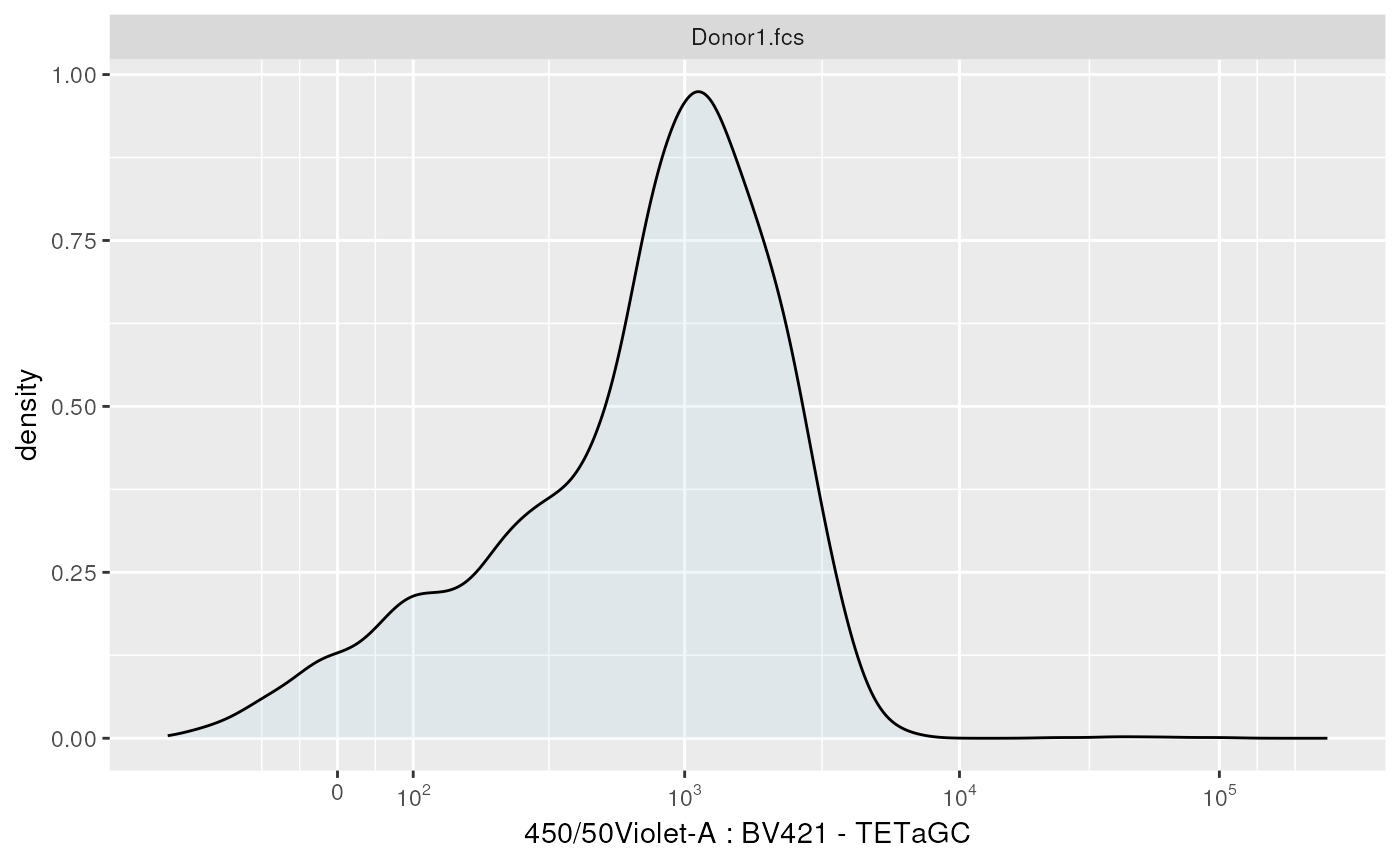
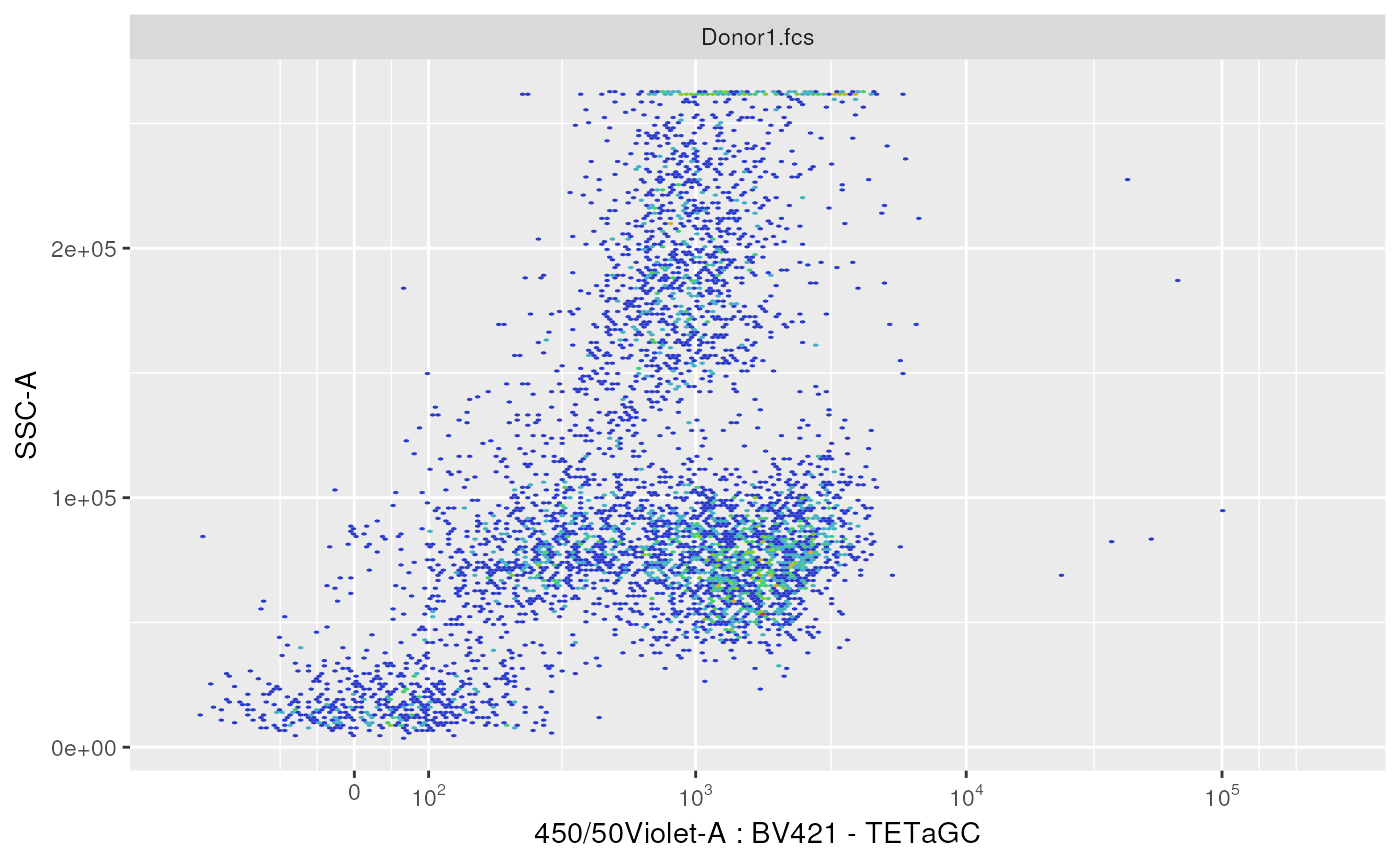
 # simple logicle scale example
ggplotEvents(OMIP021Samples[[1]],
xChannel = "450/50Violet-A",
xScale = "logicle")
# simple logicle scale example
ggplotEvents(OMIP021Samples[[1]],
xChannel = "450/50Violet-A",
xScale = "logicle")
 # logicle scale, explicit parameters
ggplotEvents(OMIP021Samples[[1]],
xChannel = "450/50Violet-A",
xScale = "logicle", xLogicleParams = list(
a = 1,
w = 2,
m = 7,
t = 270000))
# logicle scale, explicit parameters
ggplotEvents(OMIP021Samples[[1]],
xChannel = "450/50Violet-A",
xScale = "logicle", xLogicleParams = list(
a = 1,
w = 2,
m = 7,
t = 270000))
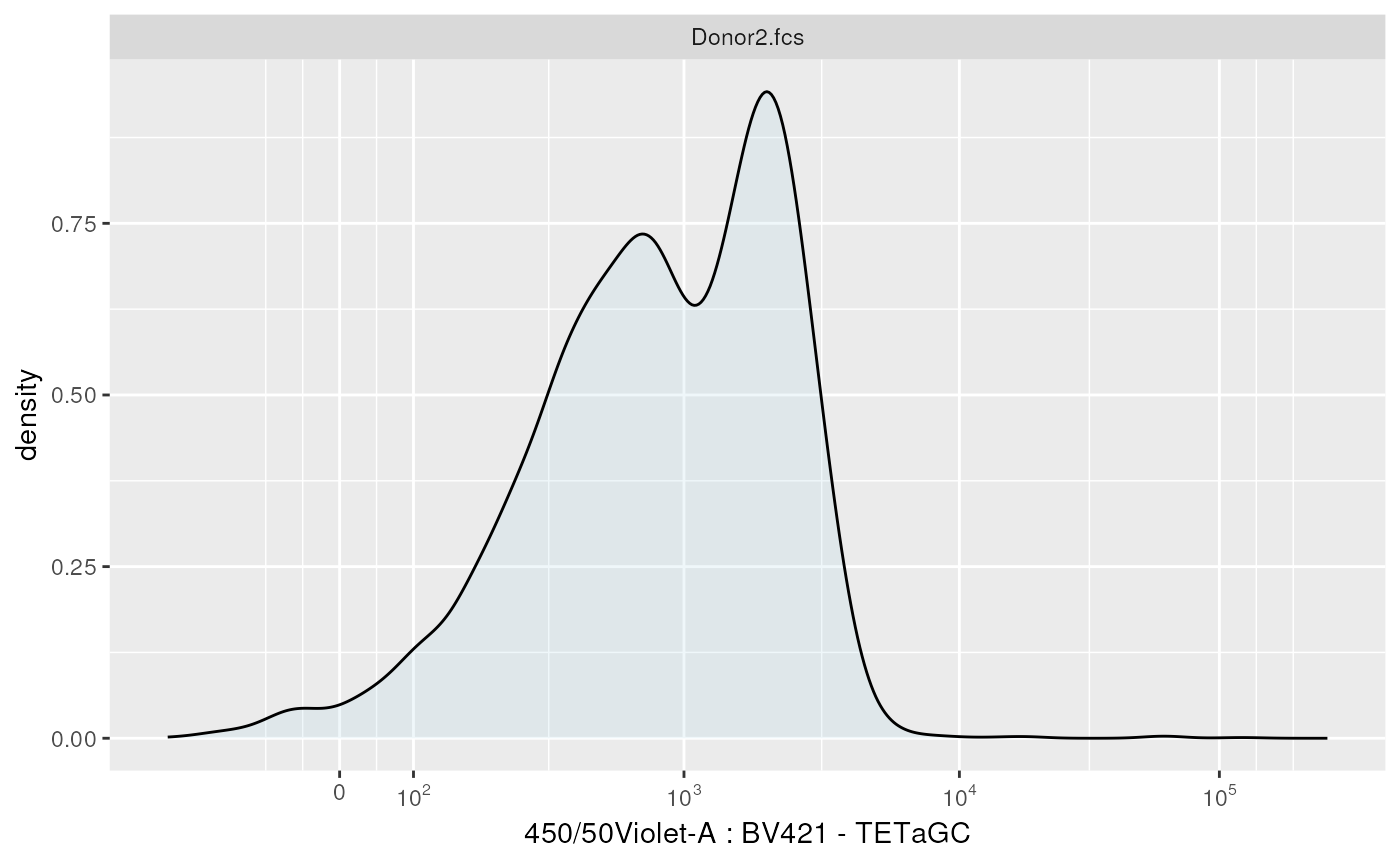
 # with sub-sampling
ggplotEvents(OMIP021Samples[[2]],
xChannel = "450/50Violet-A",
xScale = "logicle", nDisplayCells = 5000)
# with sub-sampling
ggplotEvents(OMIP021Samples[[2]],
xChannel = "450/50Violet-A",
xScale = "logicle", nDisplayCells = 5000)
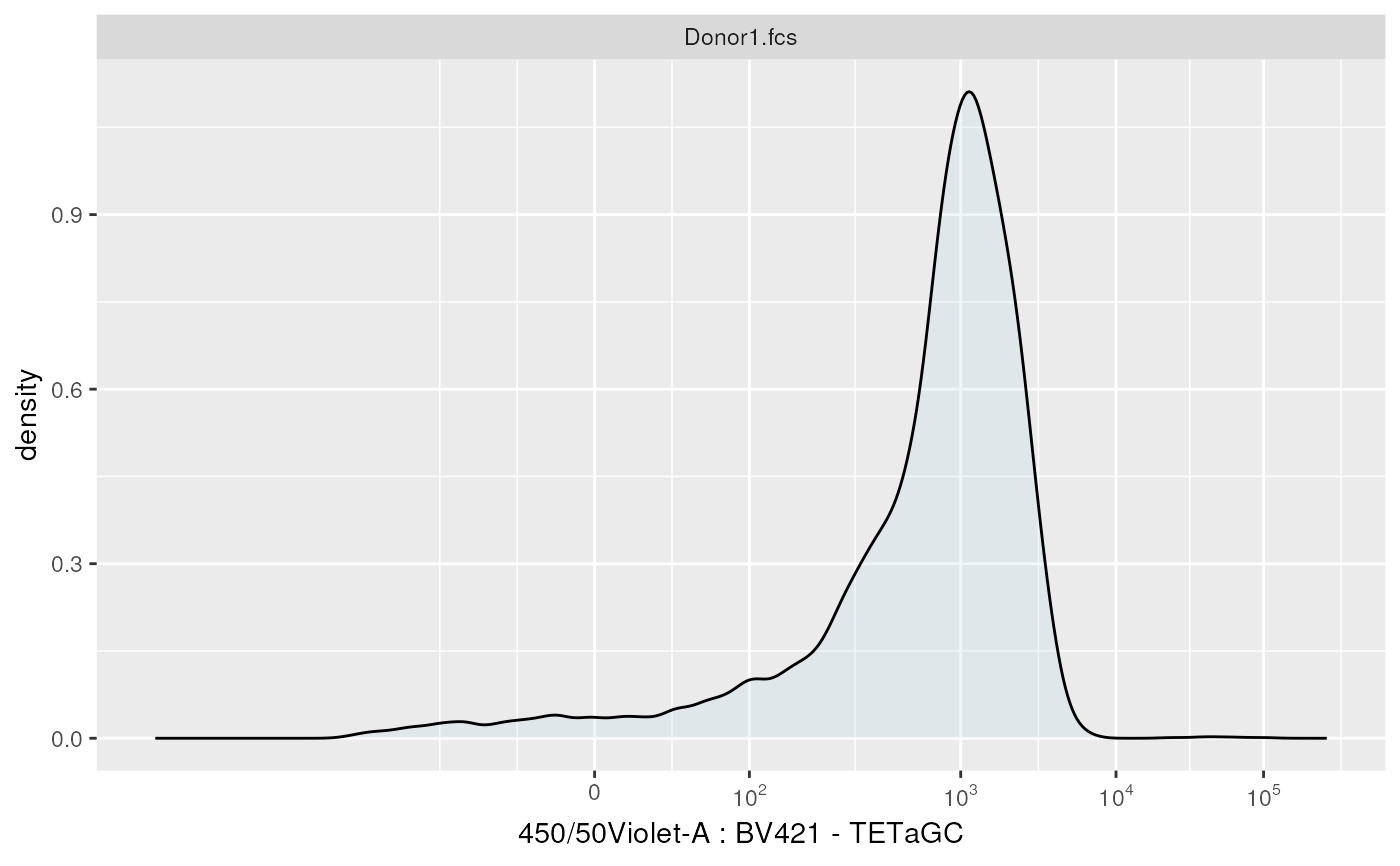
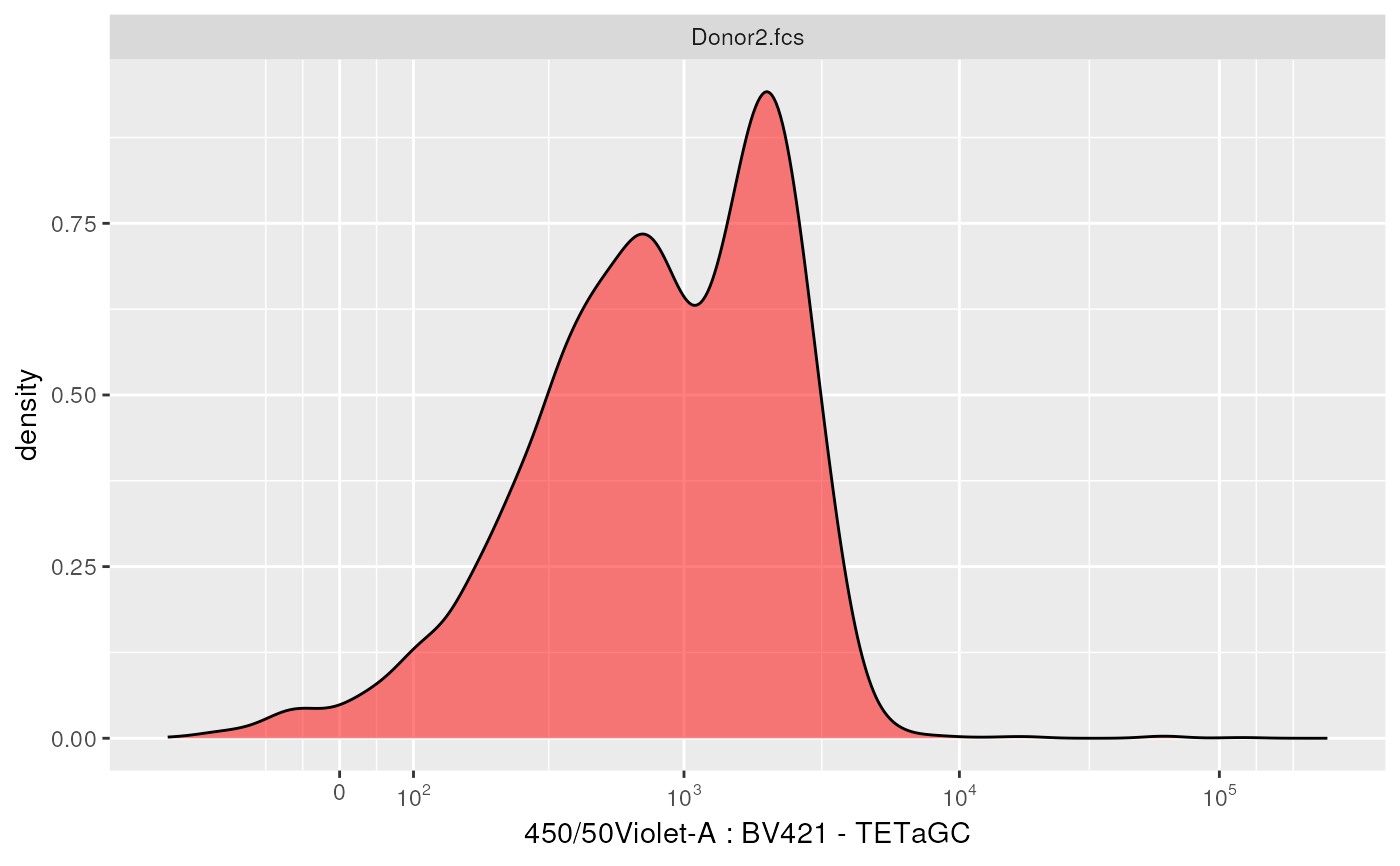
 # tuning some plot parameters
ggplotEvents(OMIP021Samples[[2]],
xChannel = "450/50Violet-A",
xScale = "logicle", alpha = 0.5, fill = "red")
# tuning some plot parameters
ggplotEvents(OMIP021Samples[[2]],
xChannel = "450/50Violet-A",
xScale = "logicle", alpha = 0.5, fill = "red")
 # examples that use a transformation list, estimated after compensation
compensationMatrix <- flowCore::spillover(OMIP021Samples[[1]])$SPILL
ffC <- runCompensation(OMIP021Samples[[1]],
spillover = compensationMatrix,
updateChannelNames = FALSE)
transList <- flowCore::estimateLogicle(
ffC,
colnames(compensationMatrix))
transList <-
c(transList,
flowCore::transformList(
"FSC-A",
flowCore::linearTransform(a = 0.00001)))
# linear example, without running the transformations on data
ggplotEvents(OMIP021Samples[[1]],
xChannel = "450/50Violet-A",
xScale = "linear",
transList = transList,
runTransforms = FALSE)
# examples that use a transformation list, estimated after compensation
compensationMatrix <- flowCore::spillover(OMIP021Samples[[1]])$SPILL
ffC <- runCompensation(OMIP021Samples[[1]],
spillover = compensationMatrix,
updateChannelNames = FALSE)
transList <- flowCore::estimateLogicle(
ffC,
colnames(compensationMatrix))
transList <-
c(transList,
flowCore::transformList(
"FSC-A",
flowCore::linearTransform(a = 0.00001)))
# linear example, without running the transformations on data
ggplotEvents(OMIP021Samples[[1]],
xChannel = "450/50Violet-A",
xScale = "linear",
transList = transList,
runTransforms = FALSE)
 # linear example, now running the transformations on data
ggplotEvents(OMIP021Samples[[1]],
xChannel = "450/50Violet-A",
xScale = "linear",
transList = transList,
runTransforms = TRUE)
# linear example, now running the transformations on data
ggplotEvents(OMIP021Samples[[1]],
xChannel = "450/50Violet-A",
xScale = "linear",
transList = transList,
runTransforms = TRUE)
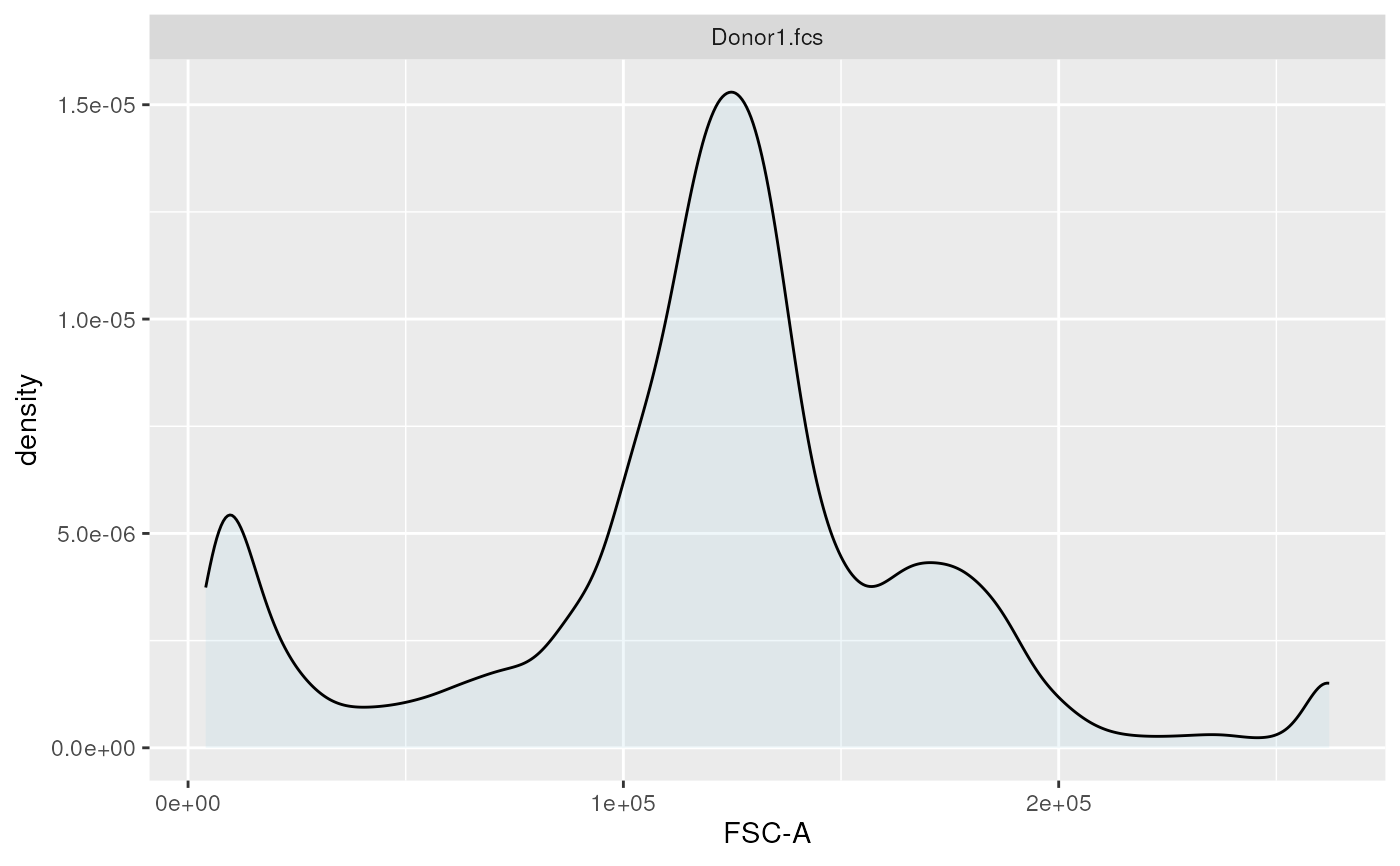
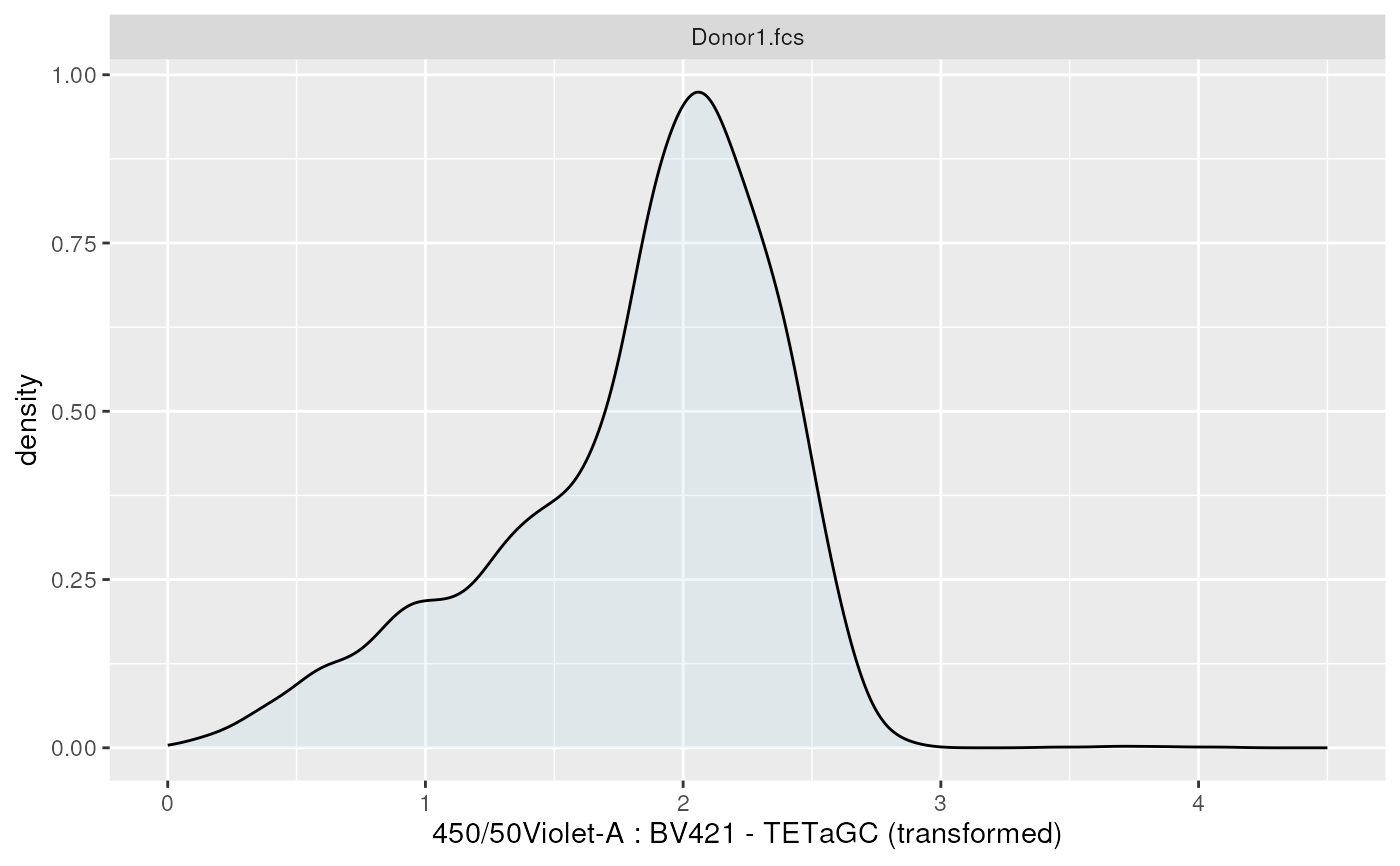 # logicle example, without running the transformations on data
ggplotEvents(OMIP021Samples[[1]],
xChannel = "FSC-A",
xScale = "logicle",
transList = transList,
runTransforms = FALSE)
# logicle example, without running the transformations on data
ggplotEvents(OMIP021Samples[[1]],
xChannel = "FSC-A",
xScale = "logicle",
transList = transList,
runTransforms = FALSE)
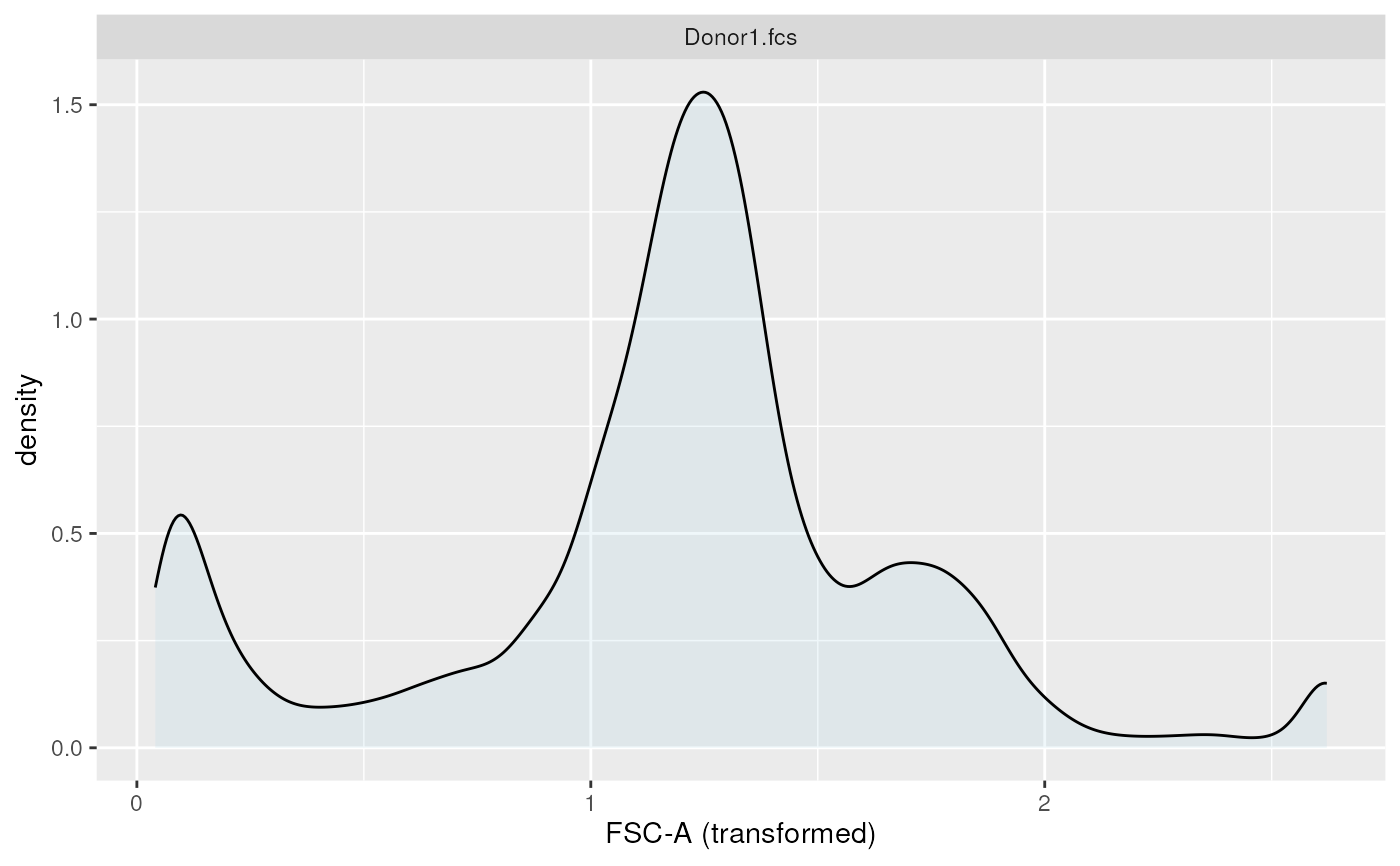
 # logicle example, now running the transformations on data
ggplotEvents(OMIP021Samples[[1]],
xChannel = "FSC-A",
xScale = "logicle",
transList = transList,
runTransforms = TRUE)
# logicle example, now running the transformations on data
ggplotEvents(OMIP021Samples[[1]],
xChannel = "FSC-A",
xScale = "logicle",
transList = transList,
runTransforms = TRUE)
 ### 2D examples ###
# simple linear example
ggplotEvents(OMIP021Samples[[1]],
xChannel = "FSC-A",
xScale = "linear",
yChannel = "610/20Violet-A",
yScale = "logicle")
### 2D examples ###
# simple linear example
ggplotEvents(OMIP021Samples[[1]],
xChannel = "FSC-A",
xScale = "linear",
yChannel = "610/20Violet-A",
yScale = "logicle")
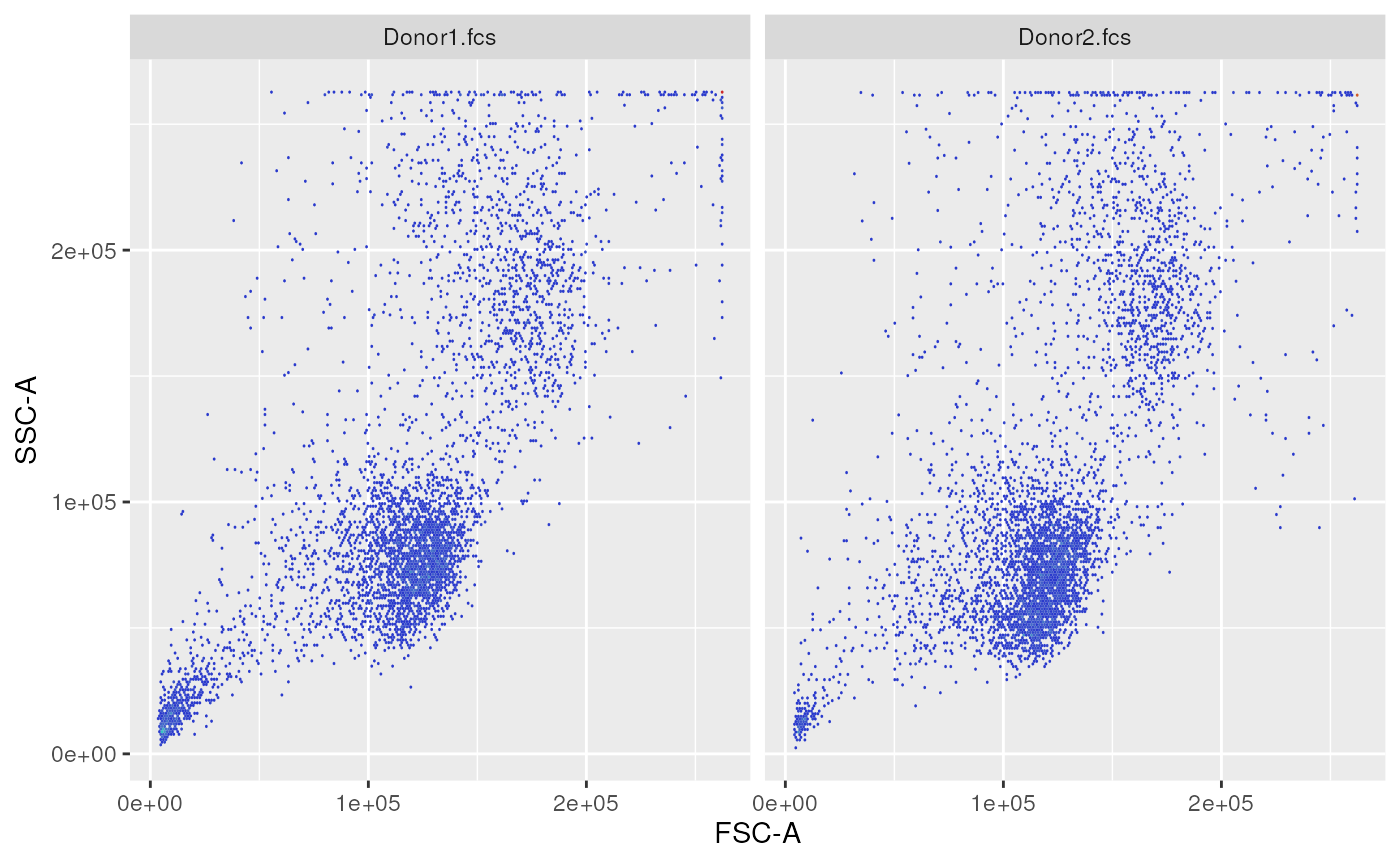
 # simple linear example, 2 flow frames
ggplotEvents(OMIP021Samples,
xChannel = "FSC-A",
xScale = "linear",
yChannel = "SSC-A",
yScale = "linear")
# simple linear example, 2 flow frames
ggplotEvents(OMIP021Samples,
xChannel = "FSC-A",
xScale = "linear",
yChannel = "SSC-A",
yScale = "linear")
 # logicle vs linear example
ggplotEvents(OMIP021Samples[[1]],
xChannel = "450/50Violet-A",
xScale = "logicle",
yChannel = "SSC-A",
yScale = "linear")
# logicle vs linear example
ggplotEvents(OMIP021Samples[[1]],
xChannel = "450/50Violet-A",
xScale = "logicle",
yChannel = "SSC-A",
yScale = "linear")
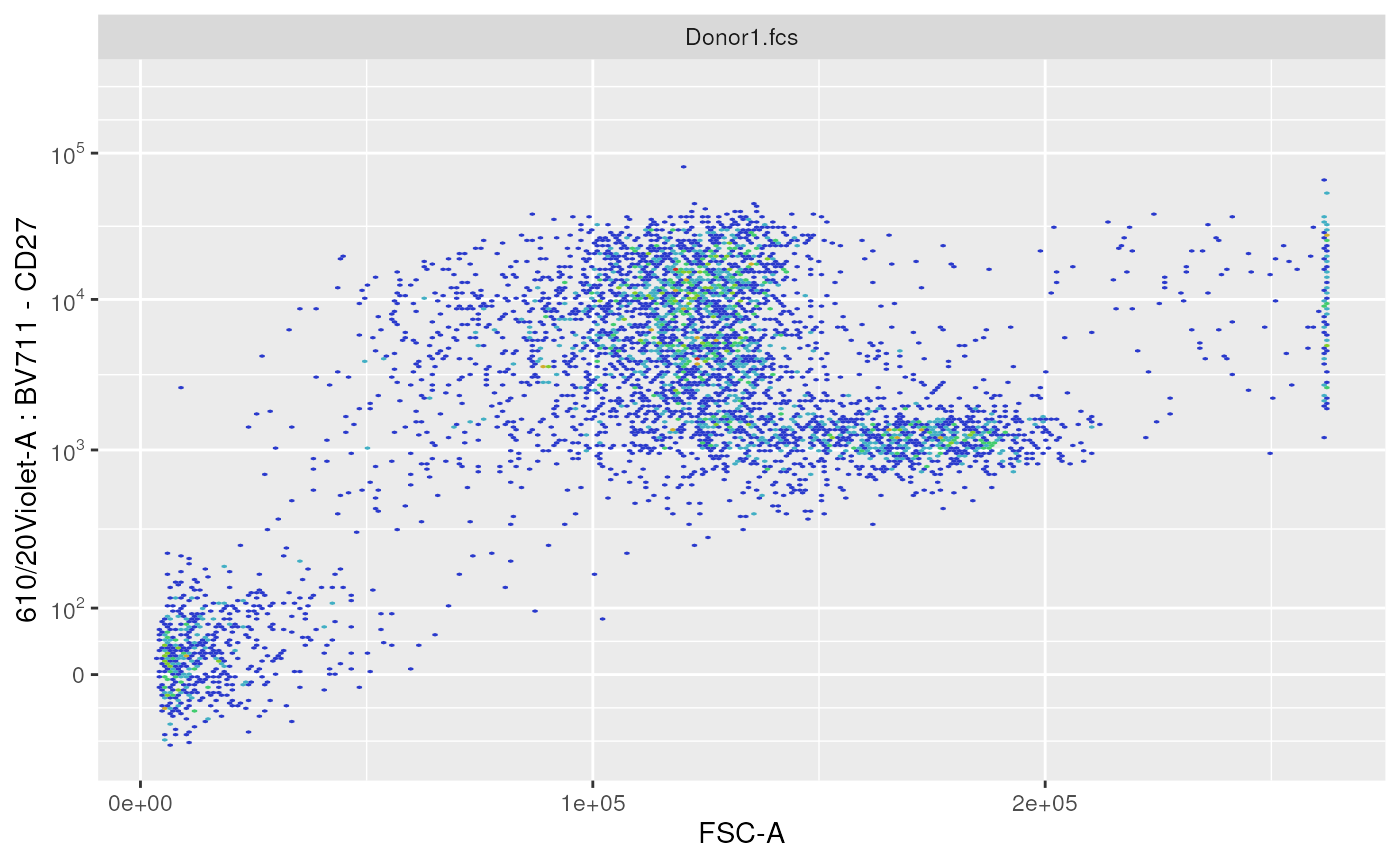
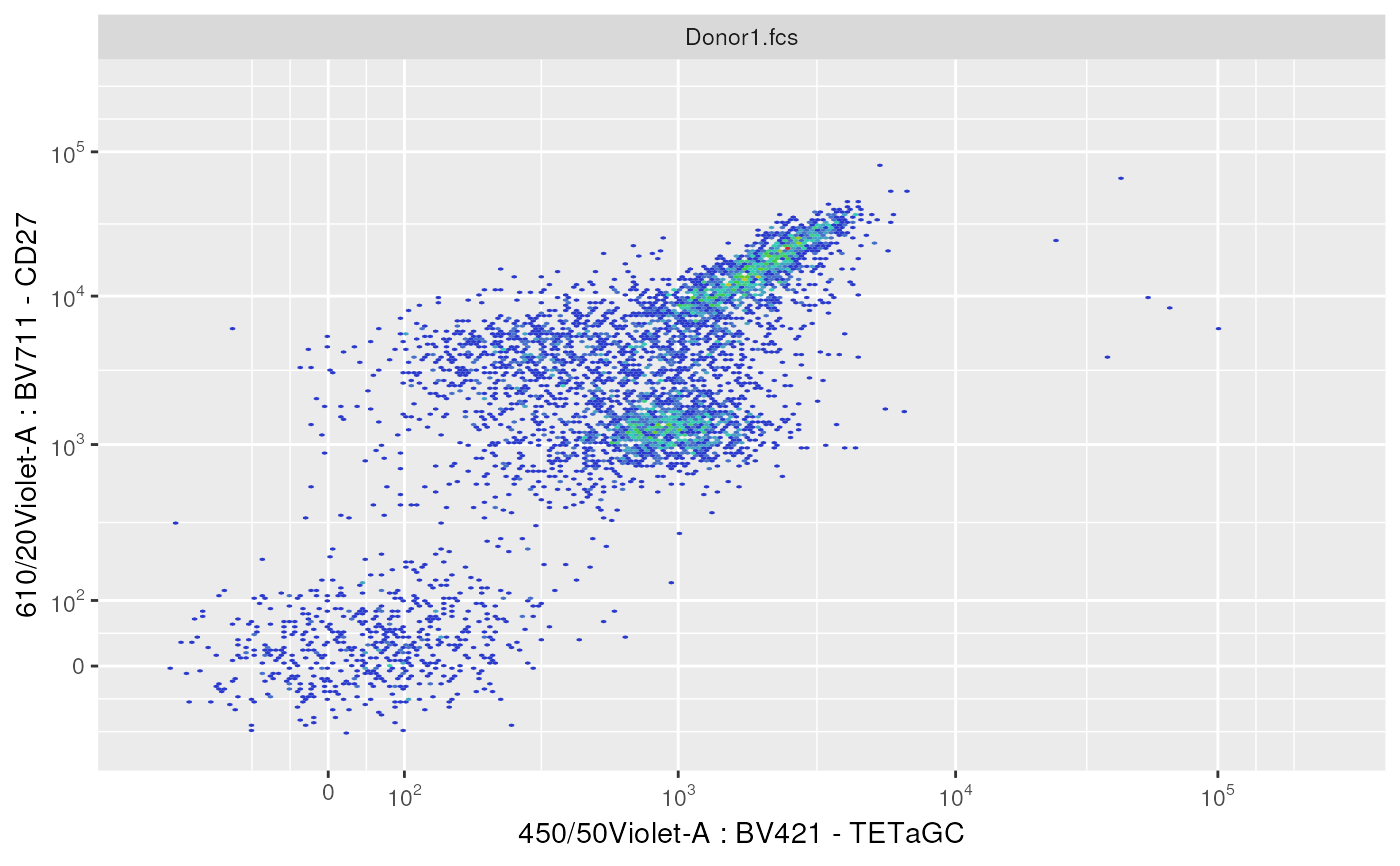
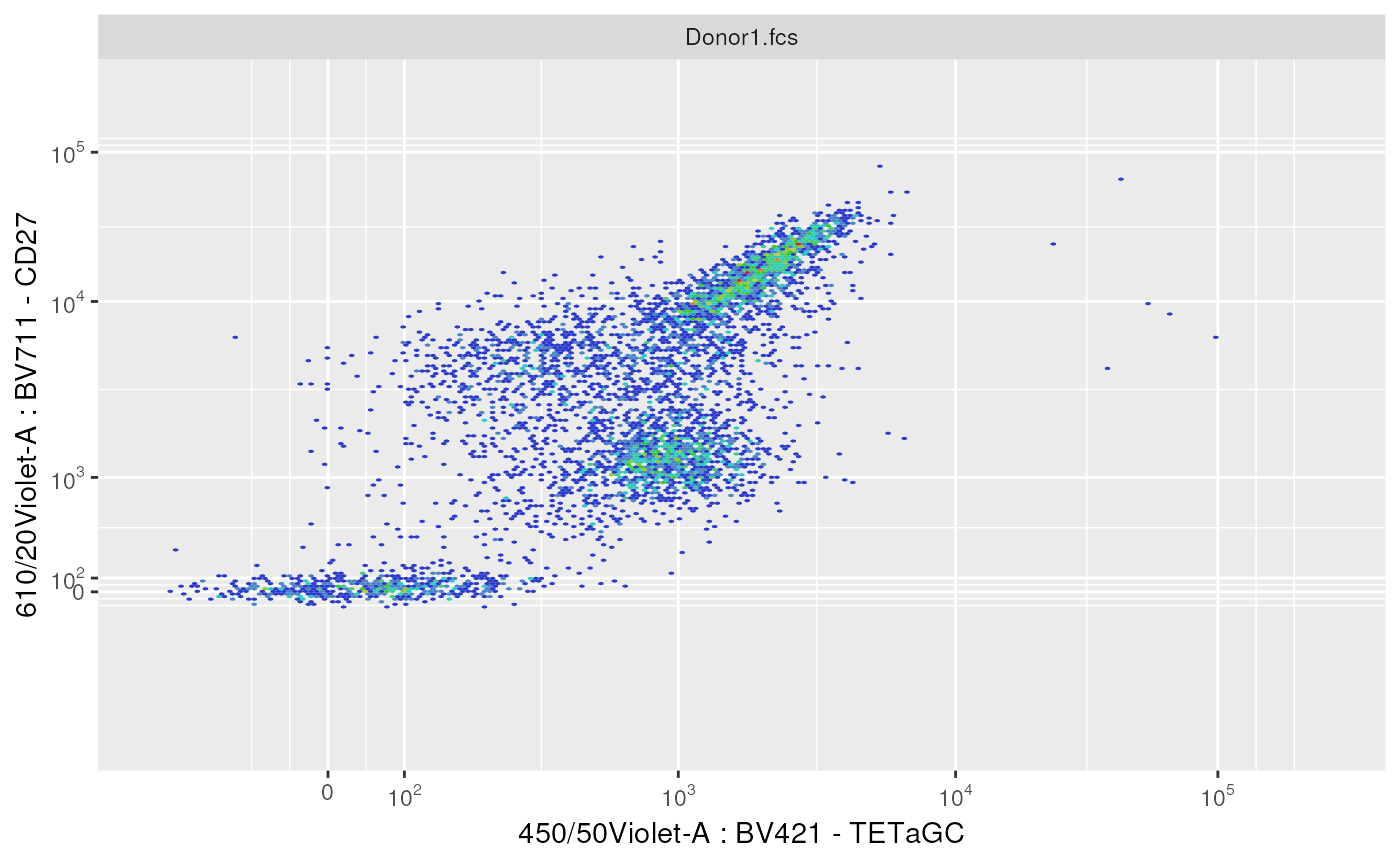
 # 2X logicle example
ggplotEvents(OMIP021Samples[[1]],
xChannel = "TETaGC",
xScale = "logicle",
yChannel = "CD27",
yScale = "logicle")
# 2X logicle example
ggplotEvents(OMIP021Samples[[1]],
xChannel = "TETaGC",
xScale = "logicle",
yChannel = "CD27",
yScale = "logicle")
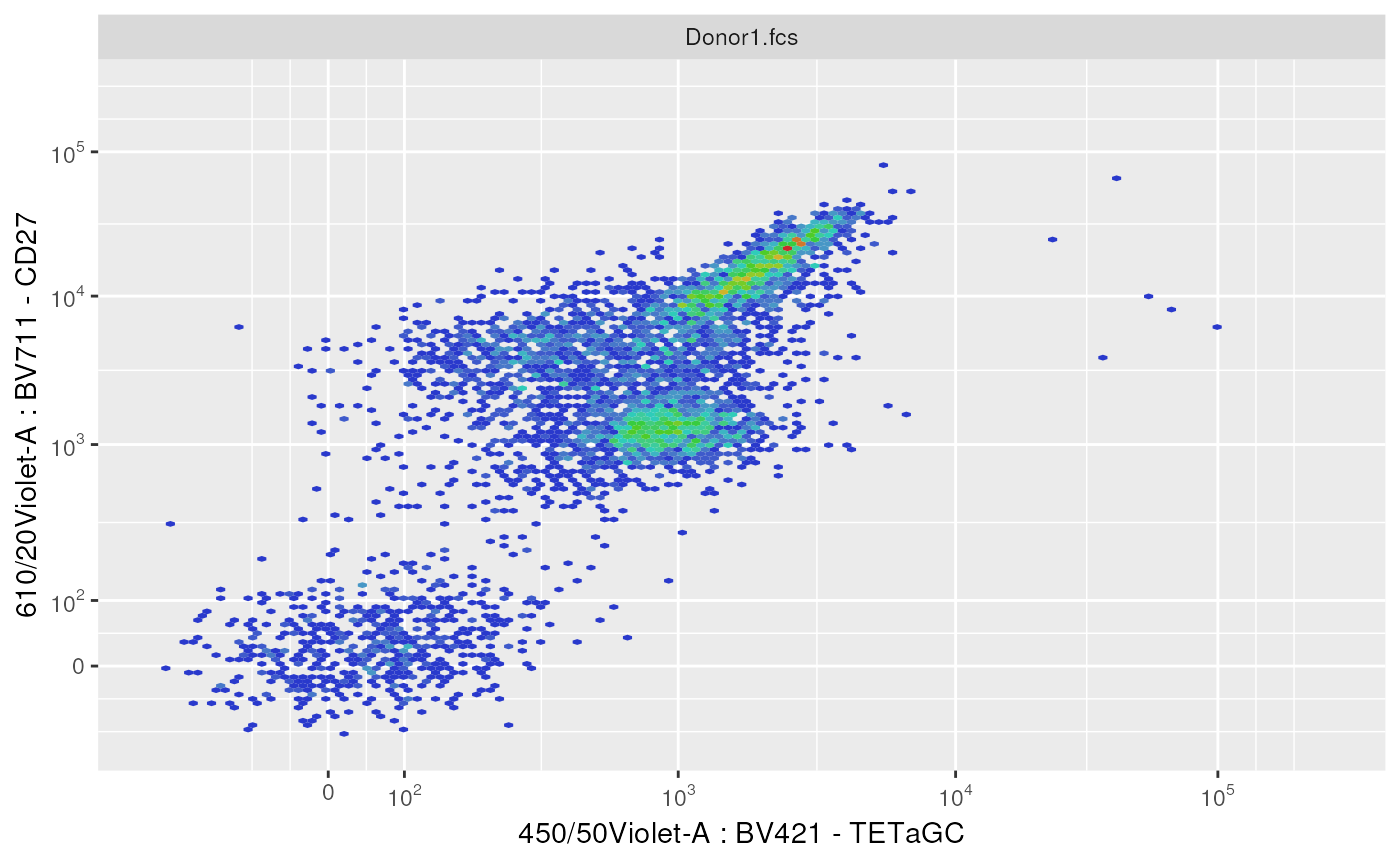
 # tuning nb of bins
ggplotEvents(OMIP021Samples[[1]],
xChannel = "TETaGC",
xScale = "logicle",
yChannel = "CD27",
yScale = "logicle",
bins = 128)
# tuning nb of bins
ggplotEvents(OMIP021Samples[[1]],
xChannel = "TETaGC",
xScale = "logicle",
yChannel = "CD27",
yScale = "logicle",
bins = 128)
 # using transformation list, not run on data
ggplotEvents(OMIP021Samples[[1]],
xChannel = "TETaGC",
xScale = "logicle",
yChannel = "CD27",
yScale = "logicle",
transList = transList,
runTransforms = FALSE)
# using transformation list, not run on data
ggplotEvents(OMIP021Samples[[1]],
xChannel = "TETaGC",
xScale = "logicle",
yChannel = "CD27",
yScale = "logicle",
transList = transList,
runTransforms = FALSE)
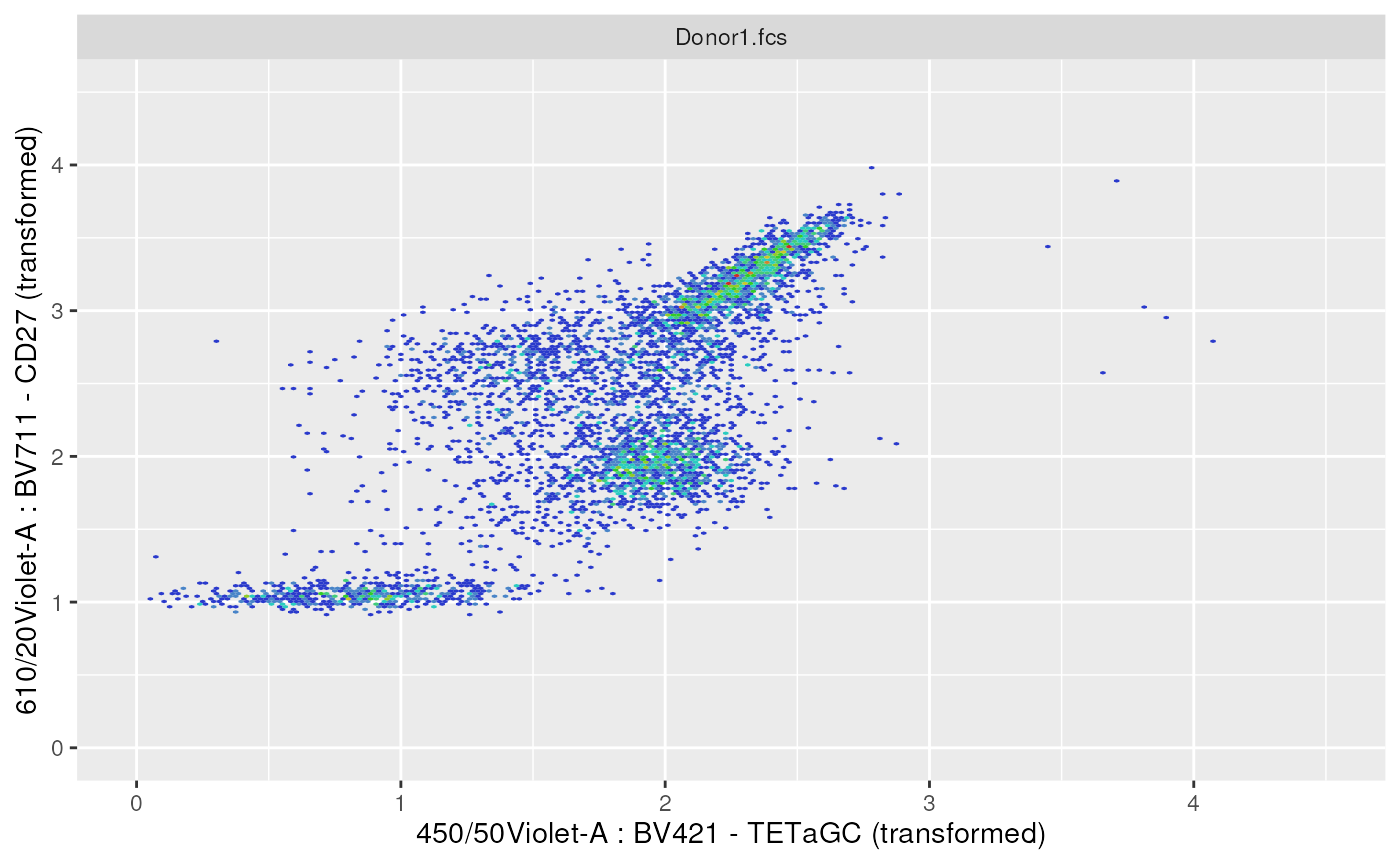
 # using transformation list, run on data
ggplotEvents(OMIP021Samples[[1]],
xChannel = "TETaGC",
xScale = "logicle",
yChannel = "CD27",
yScale = "logicle",
transList = transList,
runTransforms = TRUE)
# using transformation list, run on data
ggplotEvents(OMIP021Samples[[1]],
xChannel = "TETaGC",
xScale = "logicle",
yChannel = "CD27",
yScale = "logicle",
transList = transList,
runTransforms = TRUE)